
Also called proportional symbol
Bubble maps
A bubble map places a circle at each location and varies its area by a number. Import point data, choose a numeric size field and set a readable size range. The size legend explains the scale; colour can show a separate category or value.
What a bubble map is
Circle area, rather than radius, is scaled across the chosen minimum and maximum sizes. The range is bounded to keep small values visible, so consult the size legend when comparing values.
Use translucent circles and restrained outlines when locations overlap. Sparse city datasets can use larger circles and labels; dense observations may read better as a heatmap.
Use it when
- One numeric magnitude per point location
- Comparing city populations, site capacity or revenue
- Showing position and magnitude together
Reach for something else when
Many overlapping circles hide one another. Reduce their size or opacity, or use a heatmap to show concentration.
Bubble maps examples
8 live maps, each listing its source format, its columns and the provenance of the data.
 CSVProportional symbol
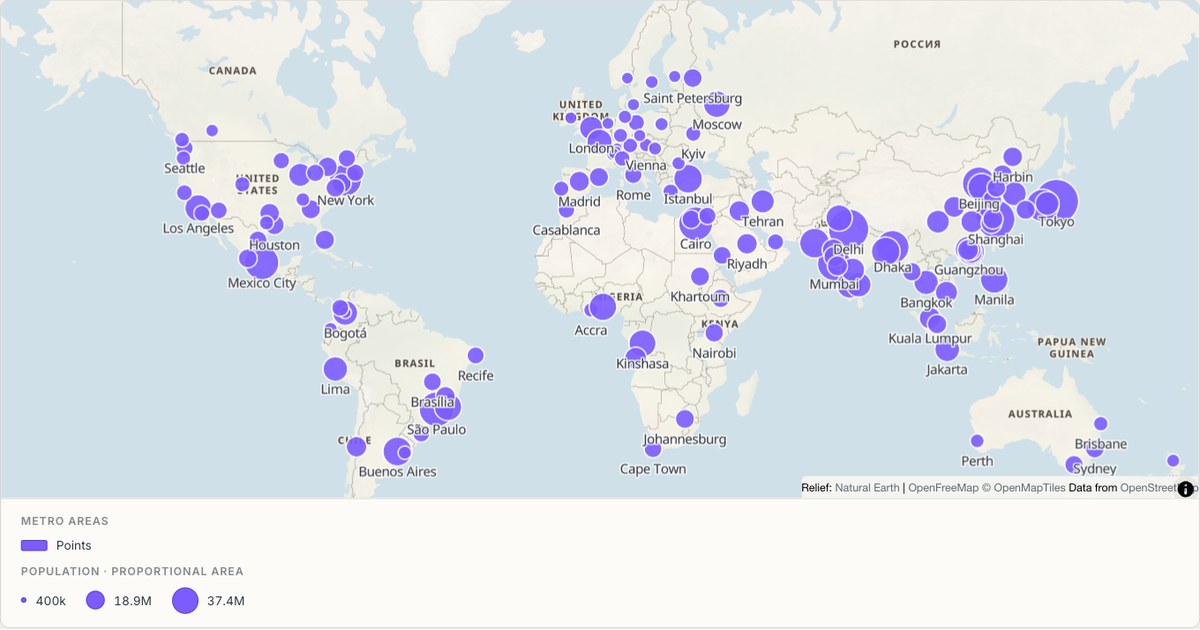
Metro areas sized by population
Proportional circles for the world’s largest metro areas. Symbol area scales with the value, not the radius, which is the difference between a map that communicates magnitude and one that exaggerates it by a factor of four.
Open map →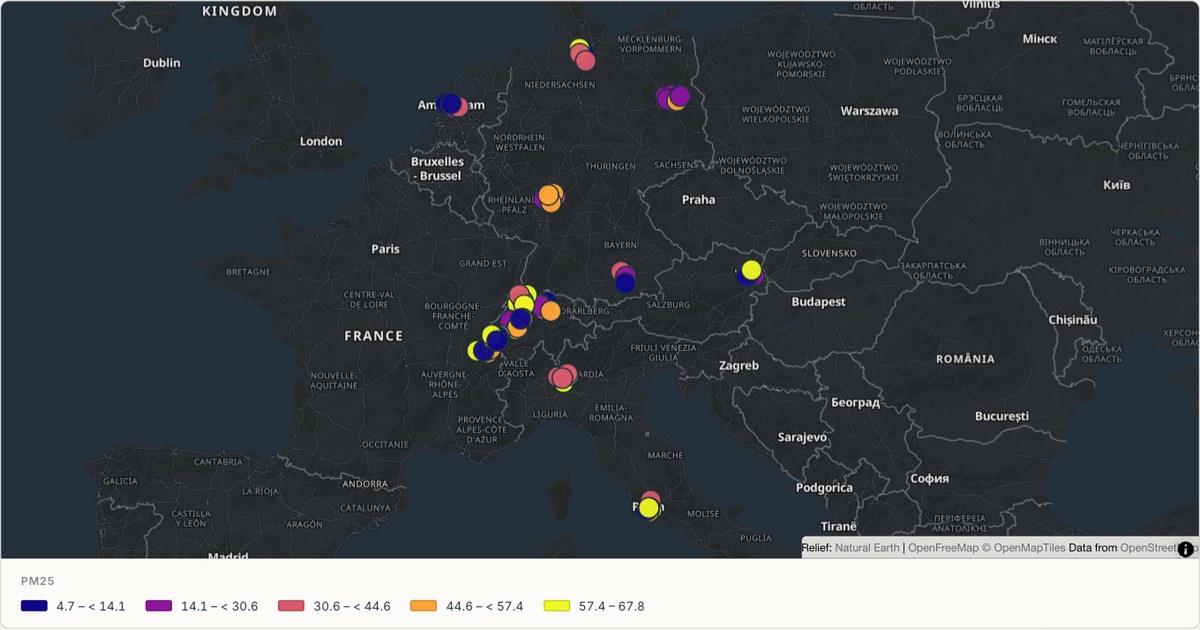 CSVClassified sensor symbols
Air quality stations across Europe
Sensor readings on a sequential colour scale, so brighter marks reveal higher simulated measurements. Larger station symbols keep each city cluster visible at a continental scale, while the legend states the numeric intervals used by the colours.
Open map →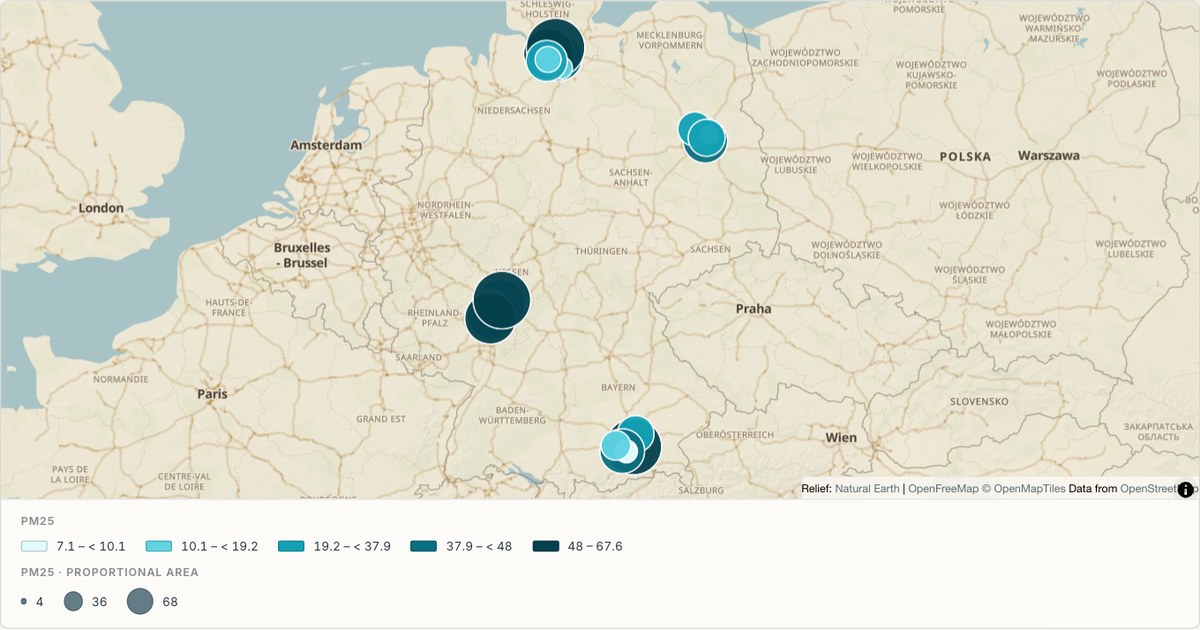 GeoJSONProportional symbol
A sensor network coloured by reading
Point data coloured on a sequential ramp, one marker per station. Sequential colour on symbols works when the markers are large enough to compare; below about eight pixels, size or clustering carries the signal better.
Open map →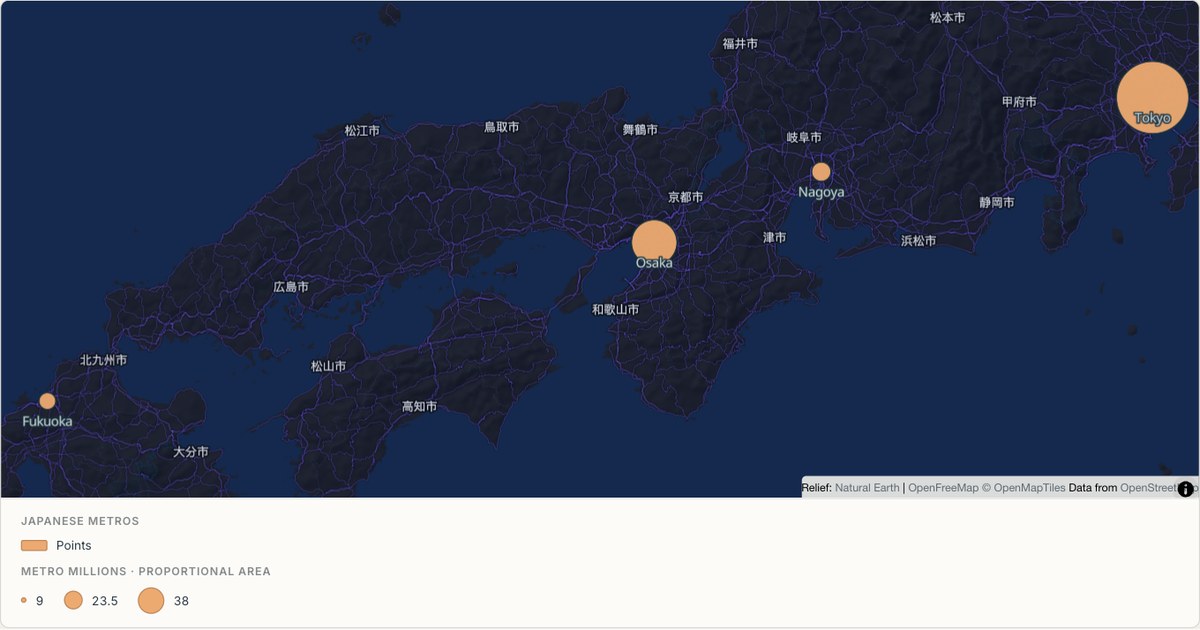 ExcelProportional symbol
Japanese metro areas
A dense coastal corridor rendered as proportional symbols over the Midnight theme. Widely varying symbol sizes need a dark, low-contrast basemap so the largest markers do not compete with the map underneath them.
Open map →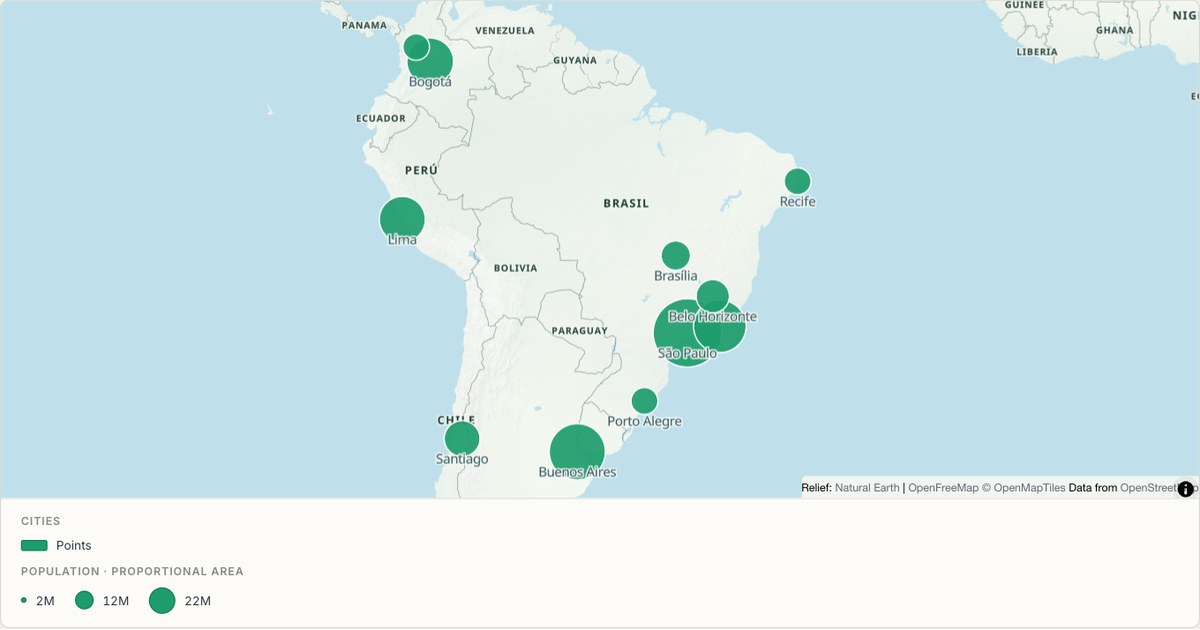 CSVProportional symbol
South American cities
Labelled city points with collision avoidance, sized by metro population. Labels are the most expensive thing on a map: they must be large enough to read, few enough to not overlap, and placed so they describe the mark they belong to.
Open map →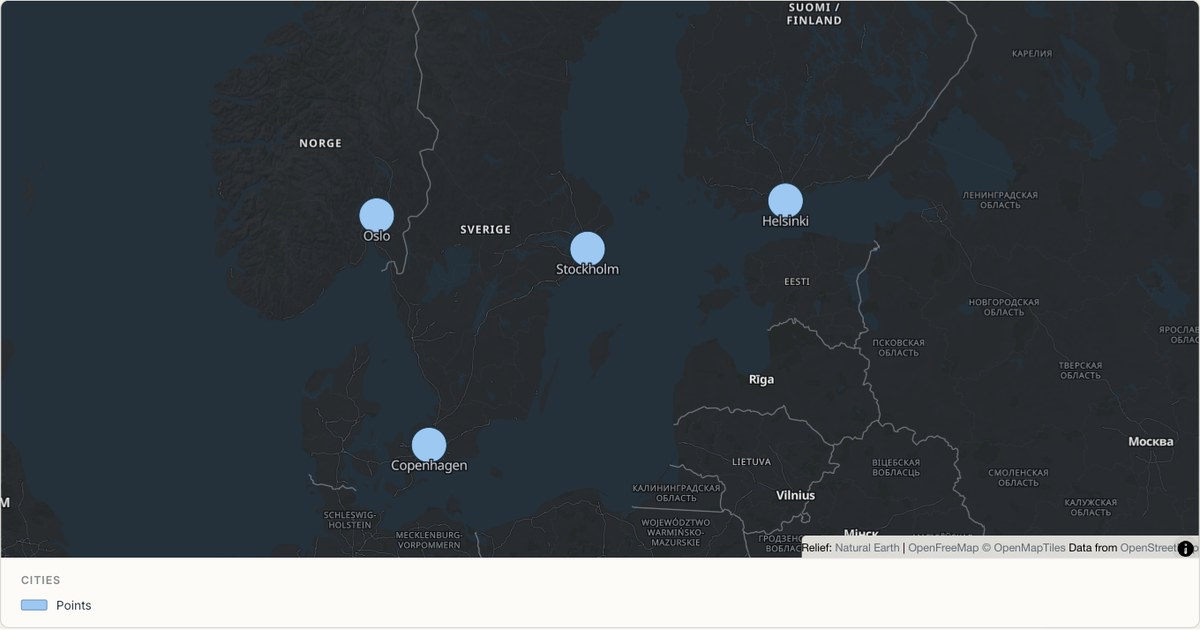 CSVPoint map
Nordic cities
A sparse point layer where each mark can afford to be generous. When a map has fewer than fifty marks, larger symbols and labels cost nothing and make the map readable at a glance rather than requiring study.
Open map →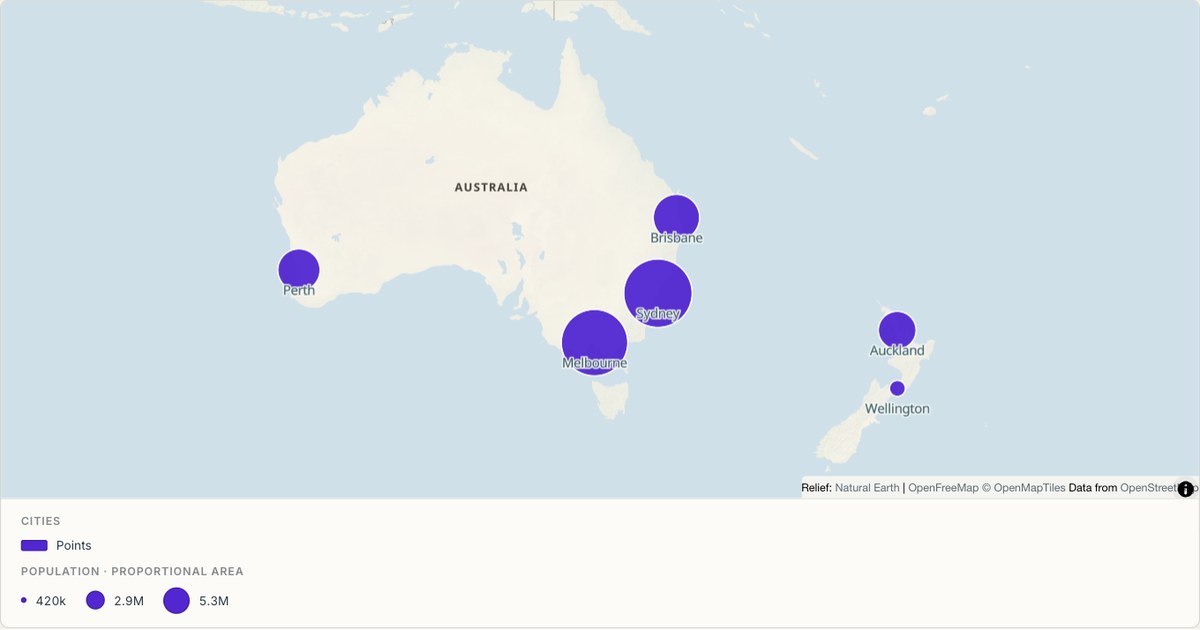 CSVPoint map
Australian coastal cities
A handful of coastal cities on a light theme, with the frame chosen to show how concentrated the population is. A map that shows emptiness is doing its job: the sparse interior is the finding.
Open map →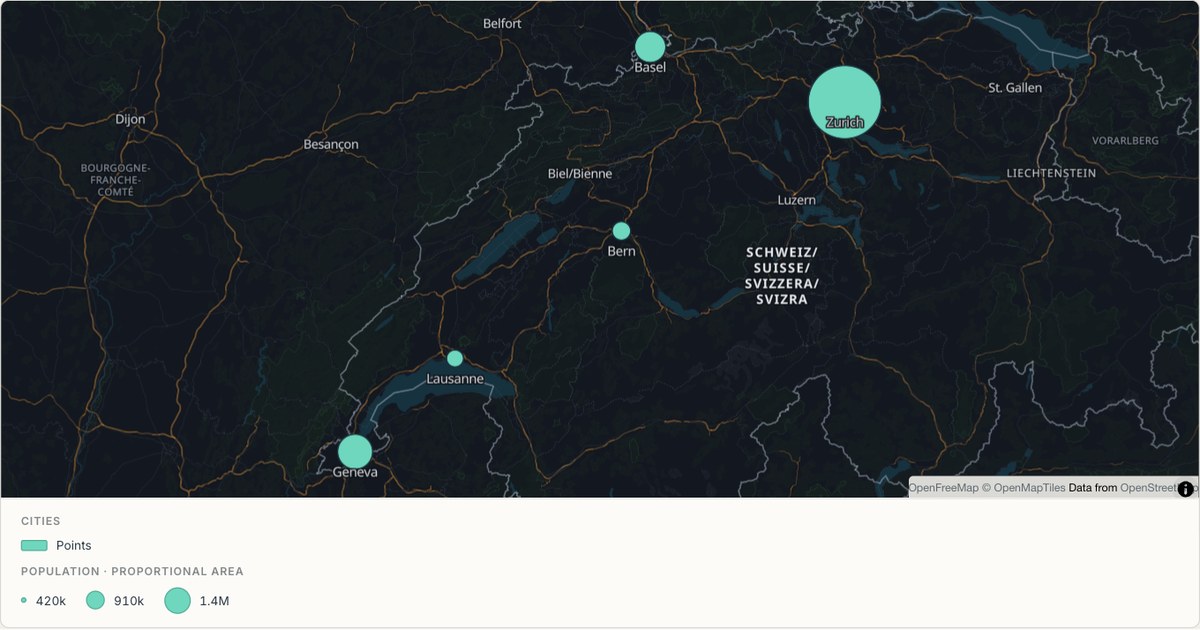 ExcelPoint map
Swiss cities at national scale
A small country at a zoom where every city is visible at once. Small extents are where basemap quality shows most: at zoom eight there is nowhere for a badly chosen road colour to hide.
Open map →
bubble map questions
- Does size represent radius or area?
- Circle area is scaled within a bounded size range. The size legend shows representative values and corresponding symbols.
- Can I label the circles?
- Yes. Select a label field. Labels may be omitted when they collide, while the feature remains available in a popup.