
Also called choropleth
Choropleth maps
A choropleth colours regions by a value. Import polygons with a numeric property and choose that column for colour, or start from a built-in boundary dataset. The examples also include categorical area maps and boundary outlines; these show geography without implying a measured statistic.
What a choropleth map is
The studio offers 275 boundary datasets, including world countries, national subdivisions, US counties and congressional districts. They are source snapshots with varying coverage and detail; a single-boundary dataset has no internal subdivisions.
Add a source through “Add a region map”. To use values from your own table, join them to polygons before importing. The studio does not automatically match a separate region-value spreadsheet to a boundary layer.
Sequential ramps suit ordered values; categorical palettes distinguish groups. Quantile, equal interval, Jenks and manual breaks are available. Check the legend and source year, and consider rates or densities when region populations differ greatly.
Use it when
- One value per region, attached to its polygon geometry
- Comparing rates, densities or groups across meaningful boundaries
- Showing regional geography with a clear source and date
Reach for something else when
Large regions dominate area maps. For point locations or totals that should be compared independently of land area, consider pins or proportional symbols.
Choropleth maps examples
280 live maps, each listing its source format, its columns and the provenance of the data.
 GeoJSONChoropleth
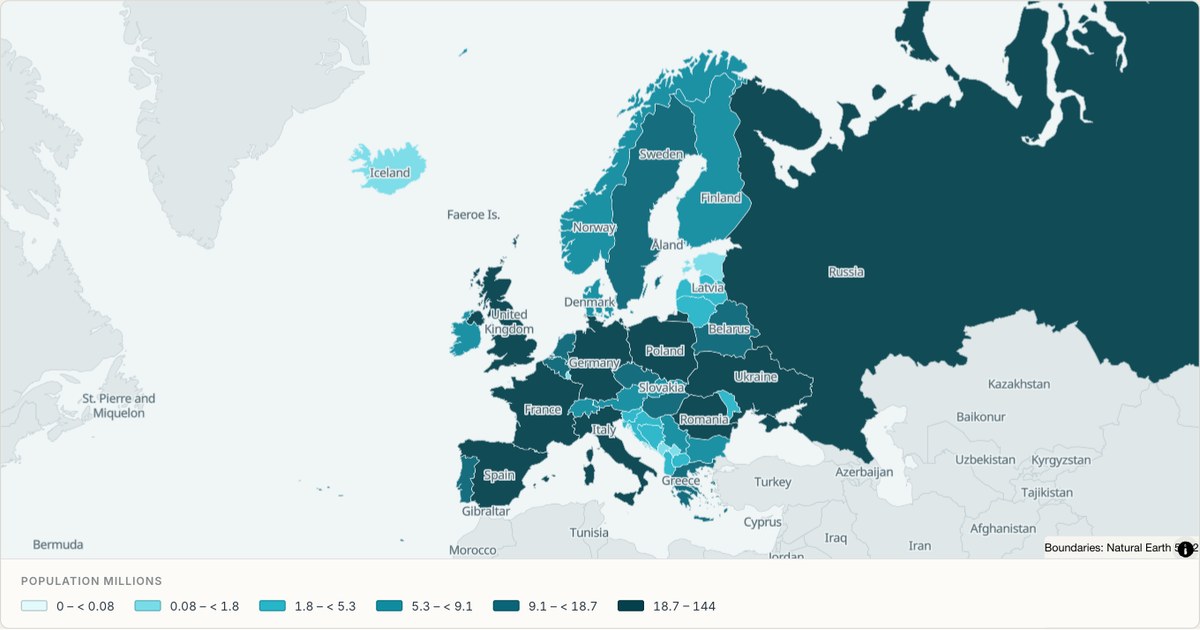
Population across Europe, country by country
A continent cut from the same world boundary set, filled from a two-column table. Countries the table has no row for stay grey, so a gap in the data is visible rather than filled in.
Open map →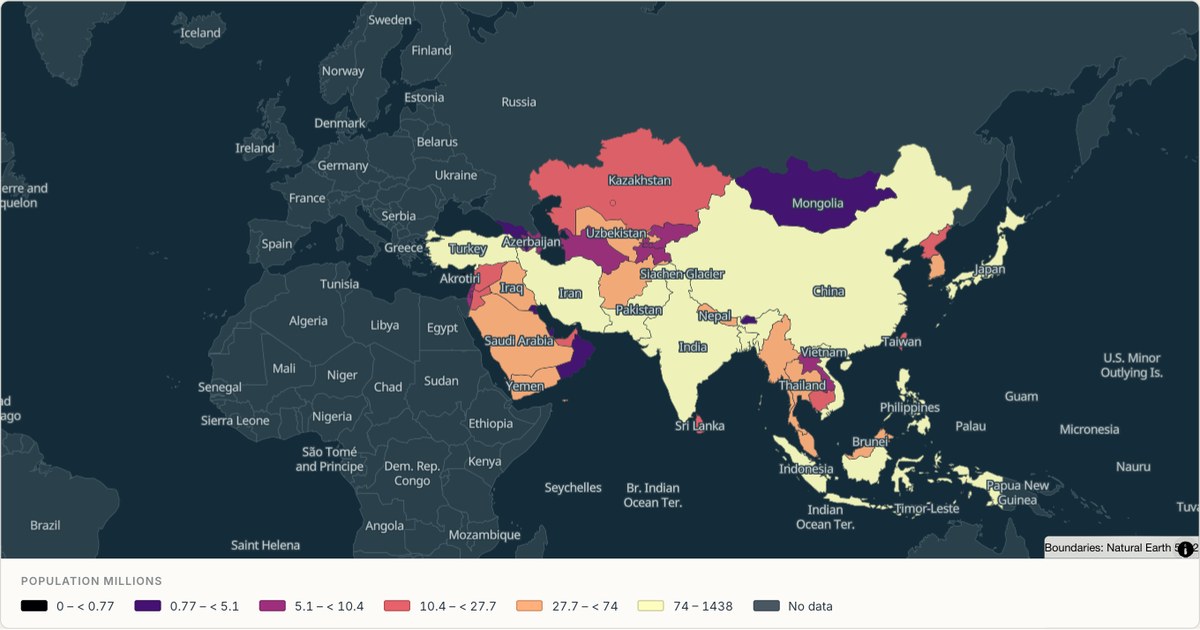 GeoJSONChoropleth
Population across Asia, country by country
The most populous continent as a choropleth, with the two extremes — China and India against the smaller states — handled by the ramp rather than flattening everything into one colour.
Open map →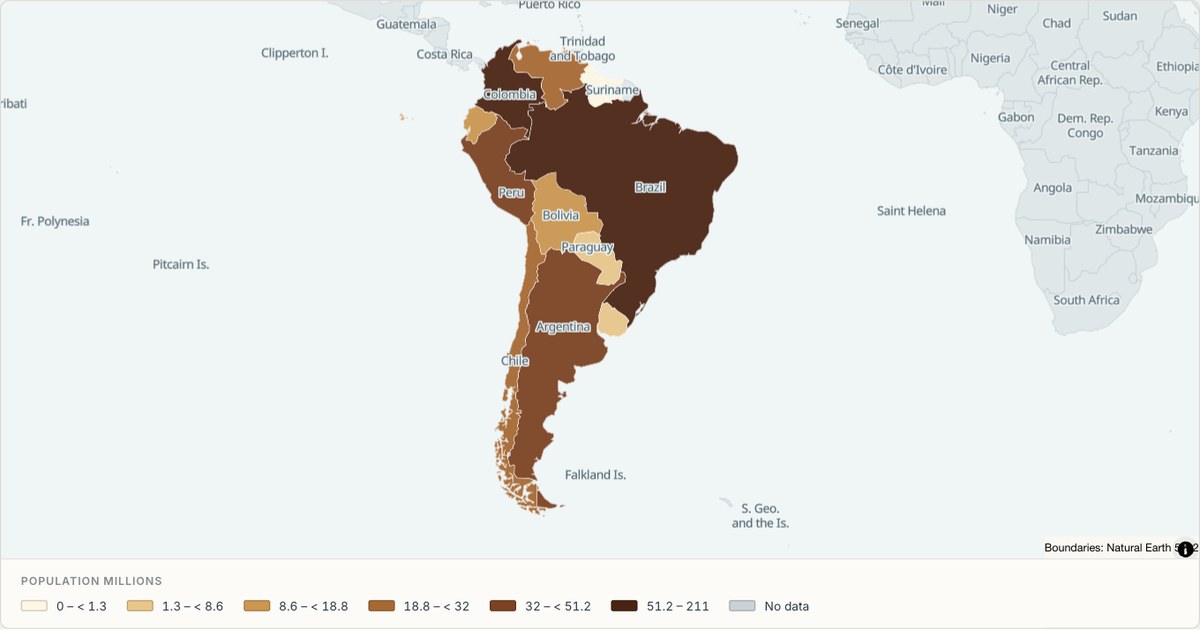 GeoJSONChoropleth
Population across South America
Countries and territories across the continent, filled by population. A small enough set that every shape is legible at once, which makes it a good demonstration of a choropleth with no outliers to hide behind.
Open map →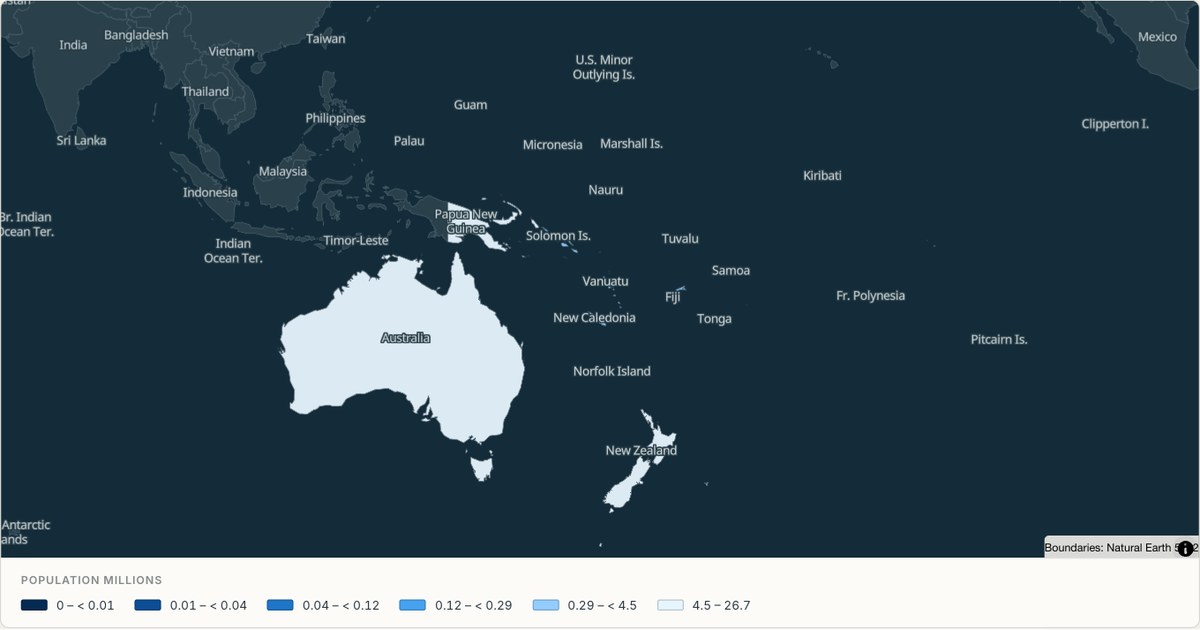 GeoJSONChoropleth
Population across Oceania
Pacific countries and territories spread across a vast ocean, which is the case that shows why a region map needs a camera of its own rather than a fit to its bounds.
Open map →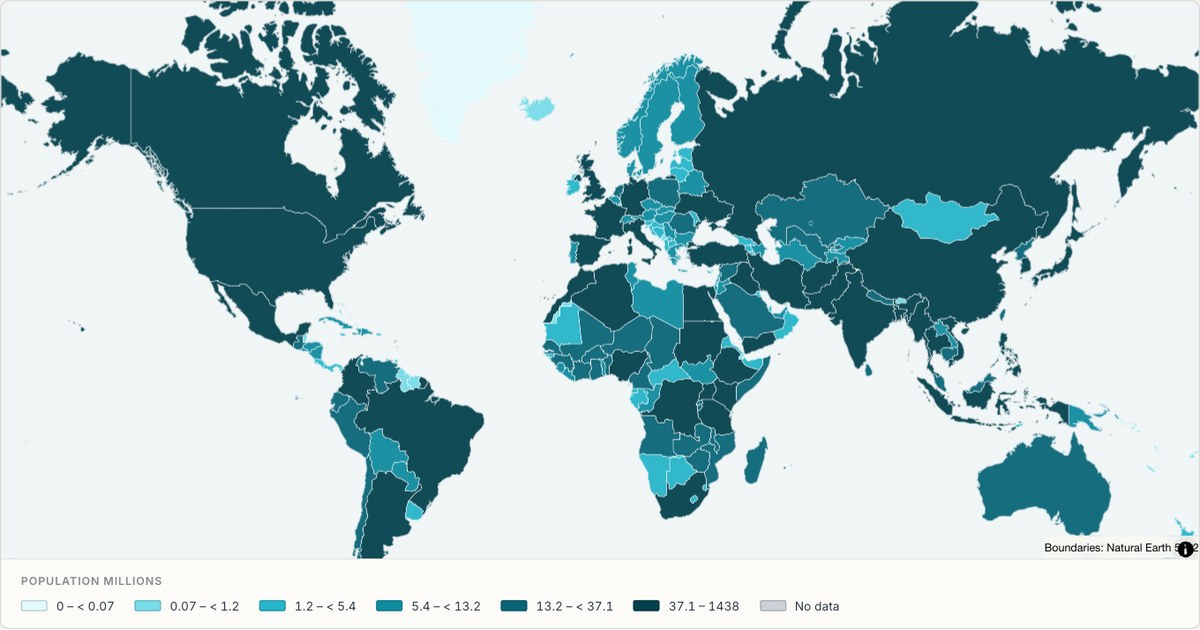 GeoJSONChoropleth
World population as a choropleth
A choropleth of world population built from a two-column table of country names and values. Countries with no matching row are drawn in grey rather than dropped, so the gap in the data is visible instead of hidden.
Open map →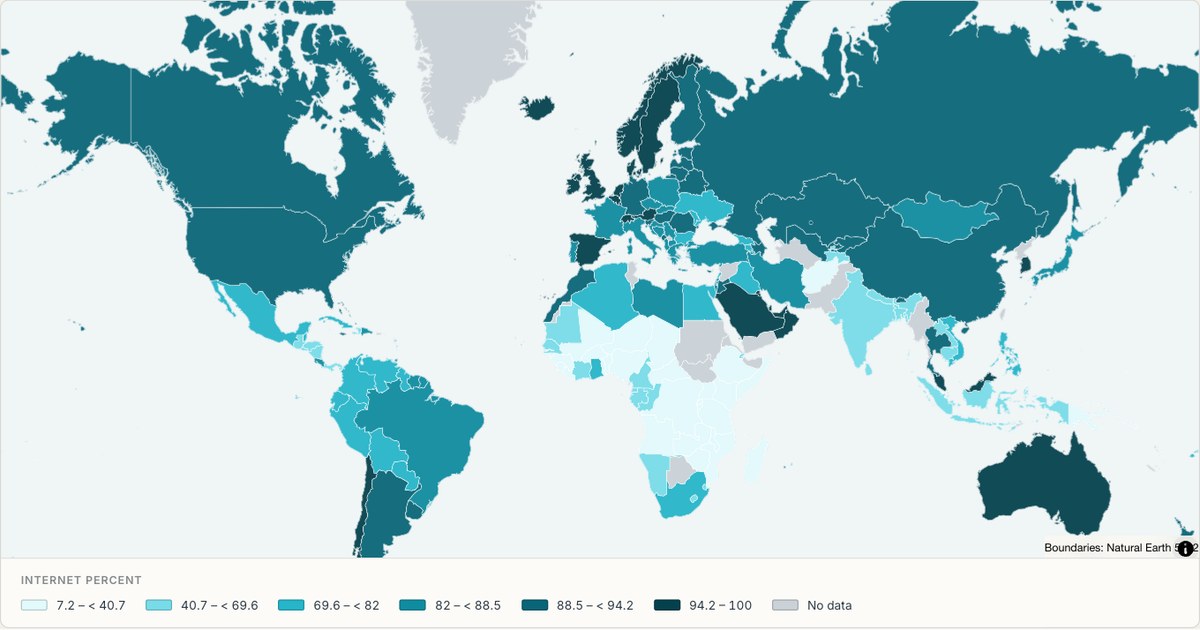 CSVChoropleth
Internet penetration by country
Percentage of the population online, drawn as a single-hue sequential choropleth. One hue with varying lightness is the correct choice when the data has a natural zero, because readers can rank areas without consulting the legend.
Open map →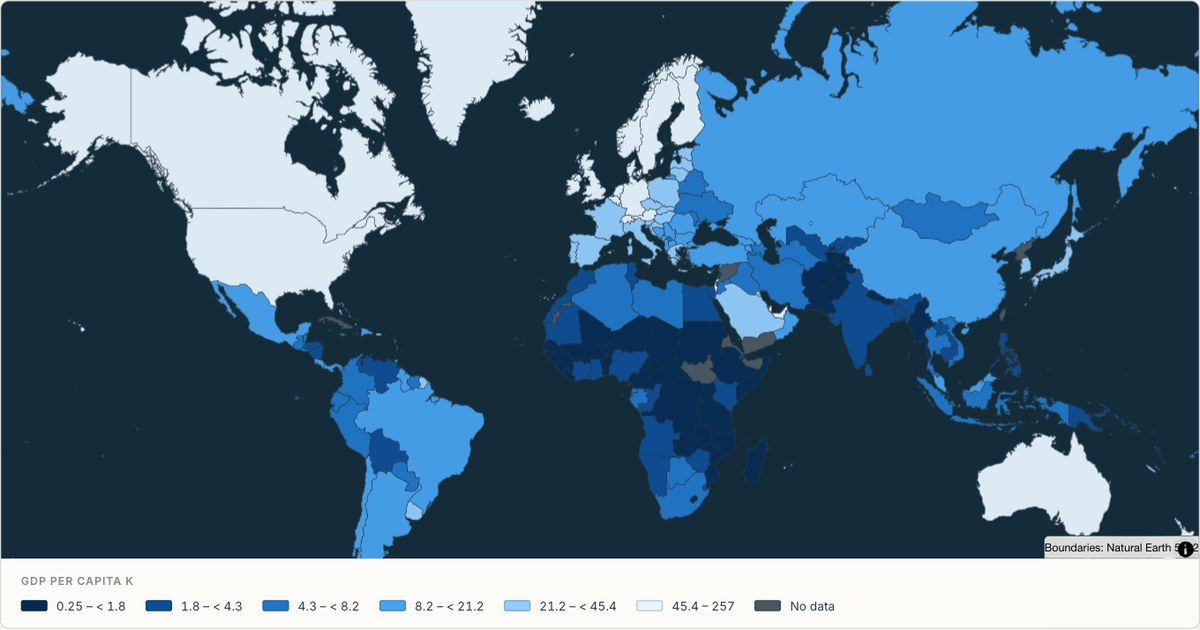 ExcelChoropleth
GDP per capita, country by country
GDP per capita in thousands of current US dollars, using the World Bank’s 2023 snapshot. A sequential scale ranks countries without inventing a meaningful midpoint; missing observations remain grey and are identified in the key.
Open map →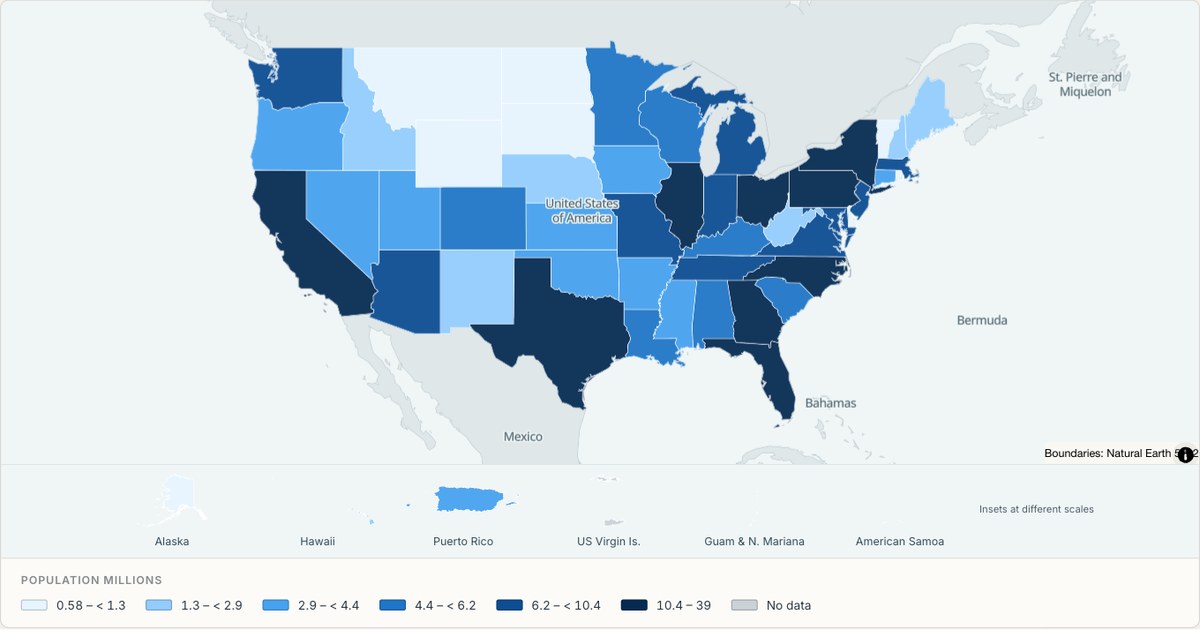 CSVChoropleth
Population by US state
All fifty states plus DC and Puerto Rico, filled from a state-name column. State outlines come from Census cartographic boundaries, so the shapes match what people expect from an official map.
Open map →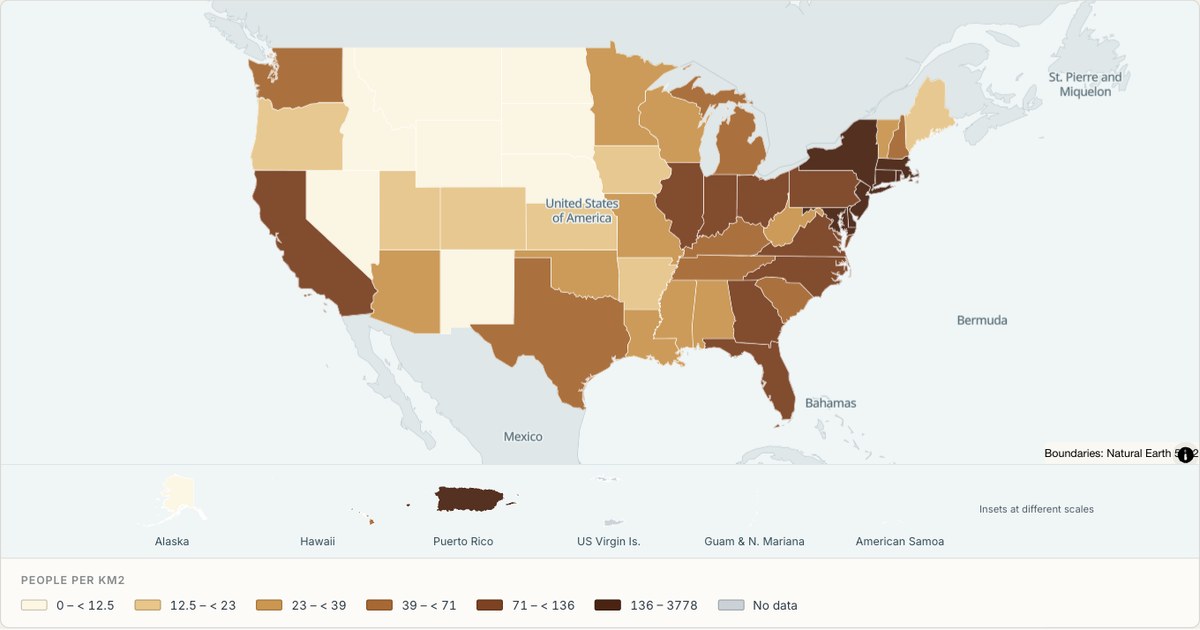 ShapefileChoropleth
Population density by state
Density computed from two columns, population and land area, rather than plotted directly. Deriving a field from the source table is the difference between a map of what you measured and a map of what you meant.
Open map →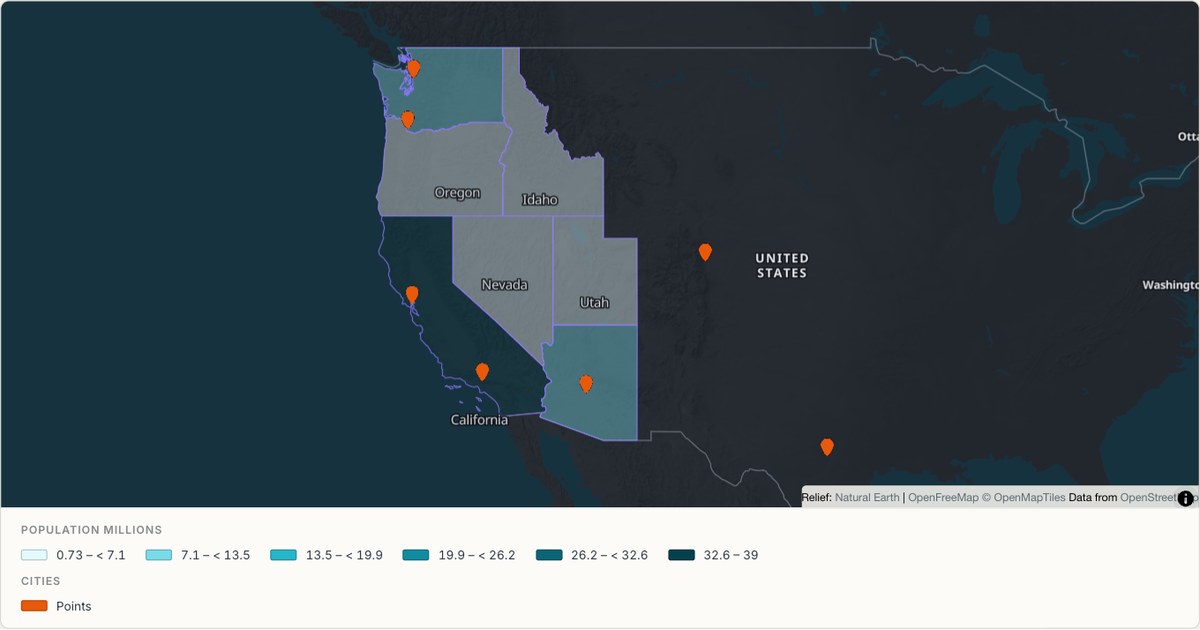 KMLMixed geometry
Areas and points from one KML file
A single file containing both polygons and placemarks, rendered as two coordinated layers. Real KML exports mix geometry types constantly; a tool that renders only the first one it finds is not finished.
Open map →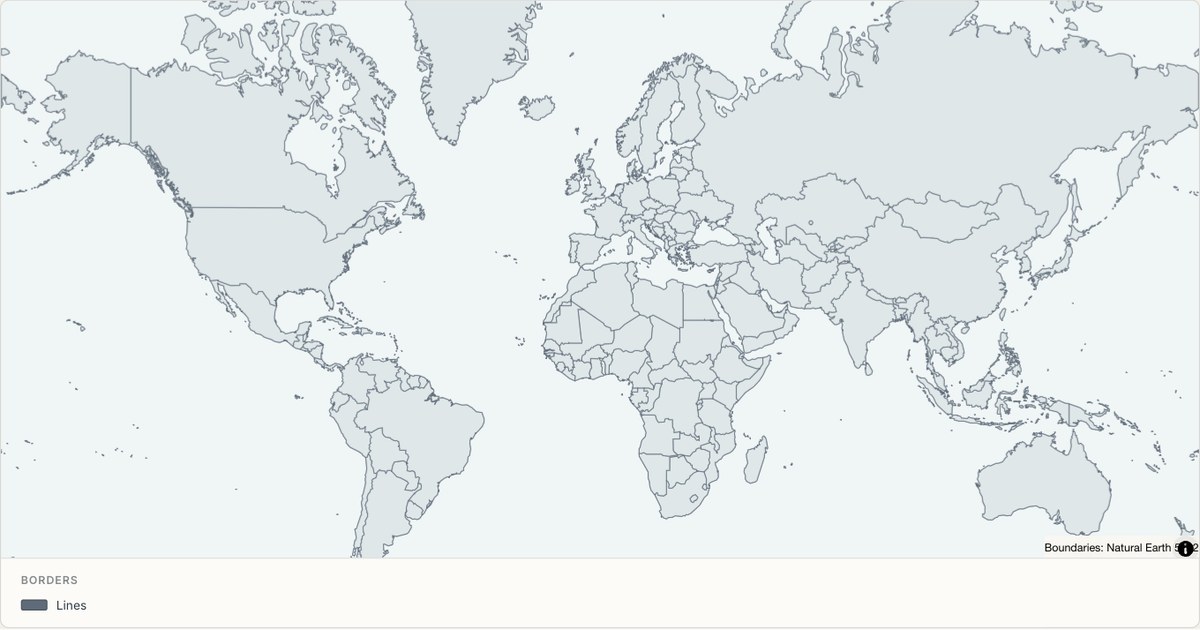 TopoJSONBoundary lines
World borders drawn as lines
TopoJSON boundaries rendered as a line layer rather than a fill. Topology shares arcs between neighbours, so border lines are drawn once instead of twice, which removes the doubled-stroke artefact at shared edges.
Open map →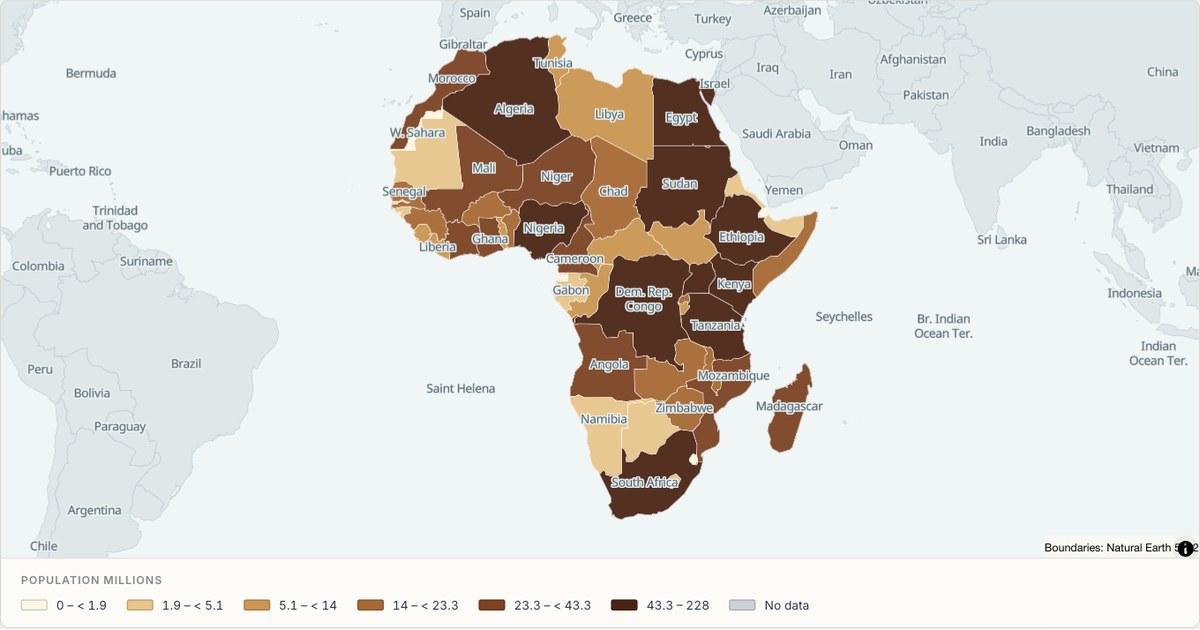 GeoJSONChoropleth
Population across Africa
A continental focus where the frame is set to Africa rather than the whole world. Choosing the frame is a cartographic decision, not a cosmetic one: a map of Africa cropped to its own bounds uses roughly three times the pixels for the same information.
Open map →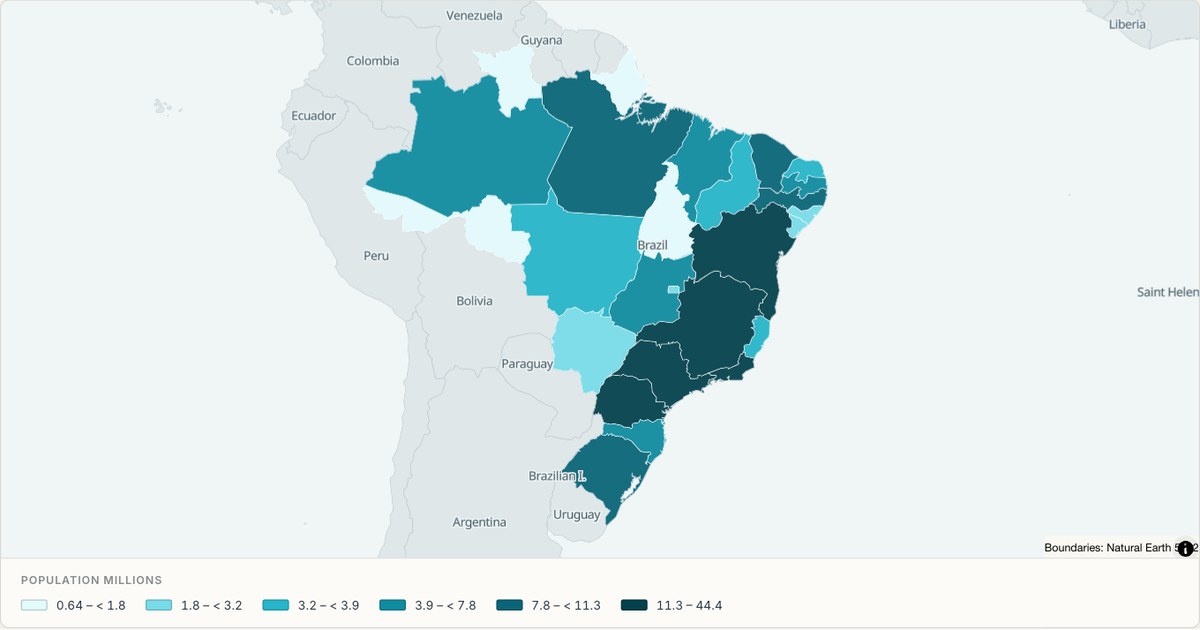 CSVChoropleth
Population across Brazil’s states
A map of Brazil’s 26 states and the Federal District, joined to IBGE’s 2022 census population. Six quantile classes separate the sparsely populated northern states from the populous southeast without hiding either behind a flat fill.
Open map →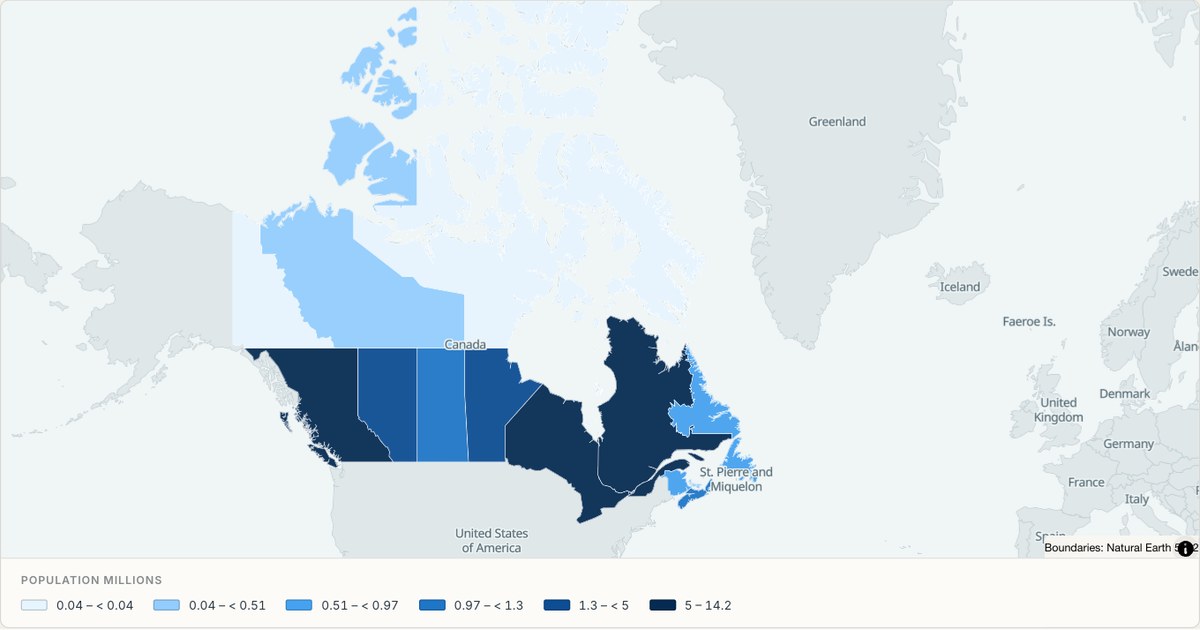 GeoJSONChoropleth
Population across Canada
All ten provinces and three territories, filled with 2021 census population. Quantile classes make the northern territories visible while preserving their real values in the popup and the numeric key below the map.
Open map →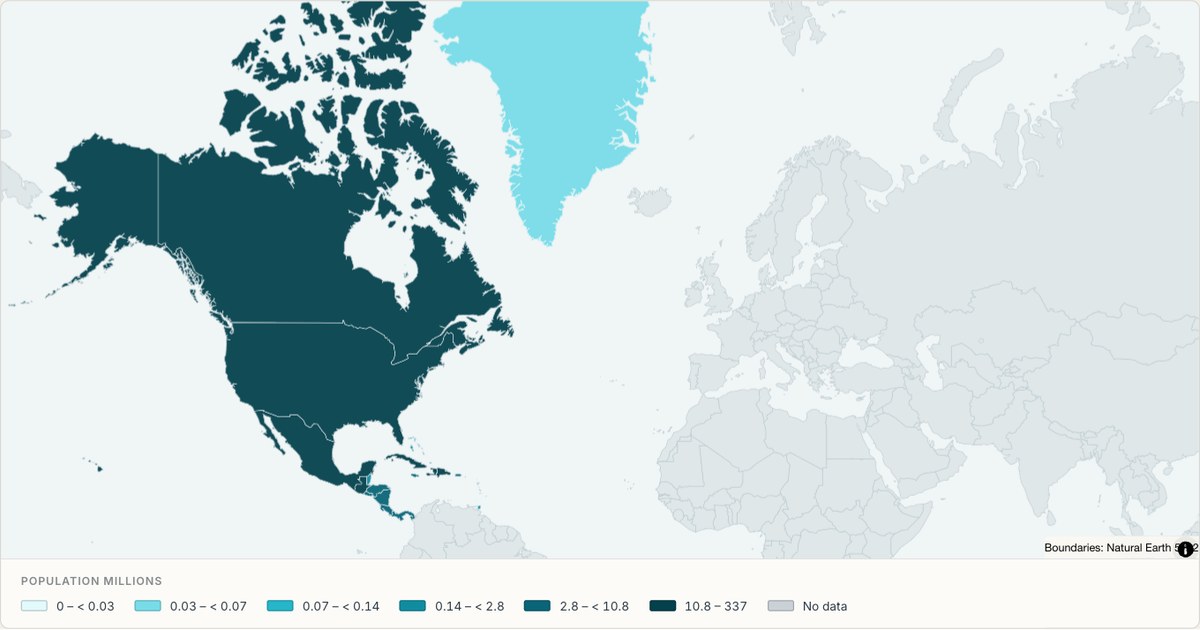 TopoJSONChoropleth
Population across North America
Compare population across North American countries and territories with values joined by stable country identifiers. Class breaks use the matched population observations, while missing values remain separate from zero. The source geometry is retained so smaller countries are still selectable.
Open map →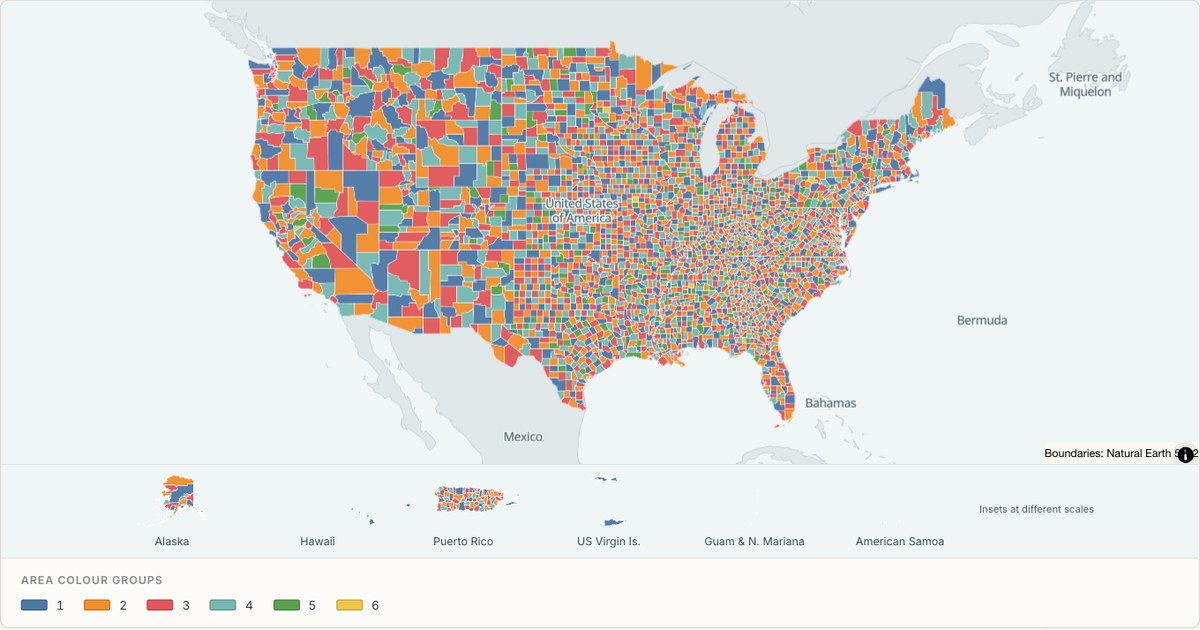 TopoJSONCategorical regions
United States counties
Explore 3,235 named areas in United States. Each boundary is selectable and carries a stable identifier, so you can add your own values or distinguish neighbouring areas with a categorical colour scheme.
Open map →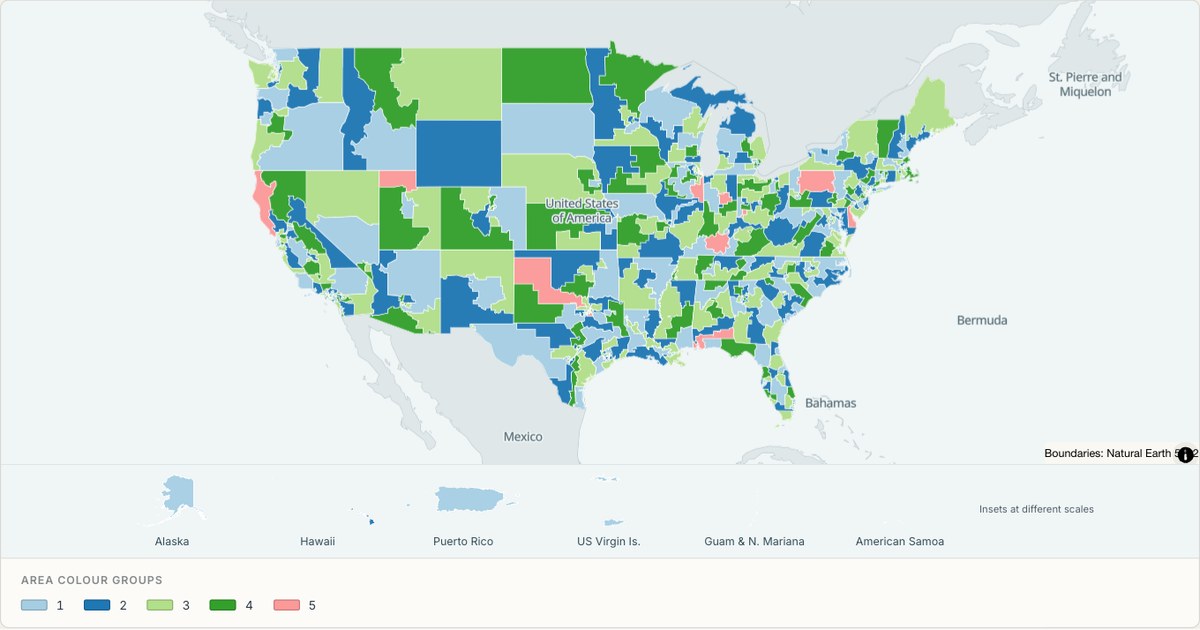 TopoJSONCategorical regions
United States 119th Congress
Explore 441 named areas in United States. Each boundary is selectable and carries a stable identifier, so you can add your own values or distinguish neighbouring areas with a categorical colour scheme.
Open map →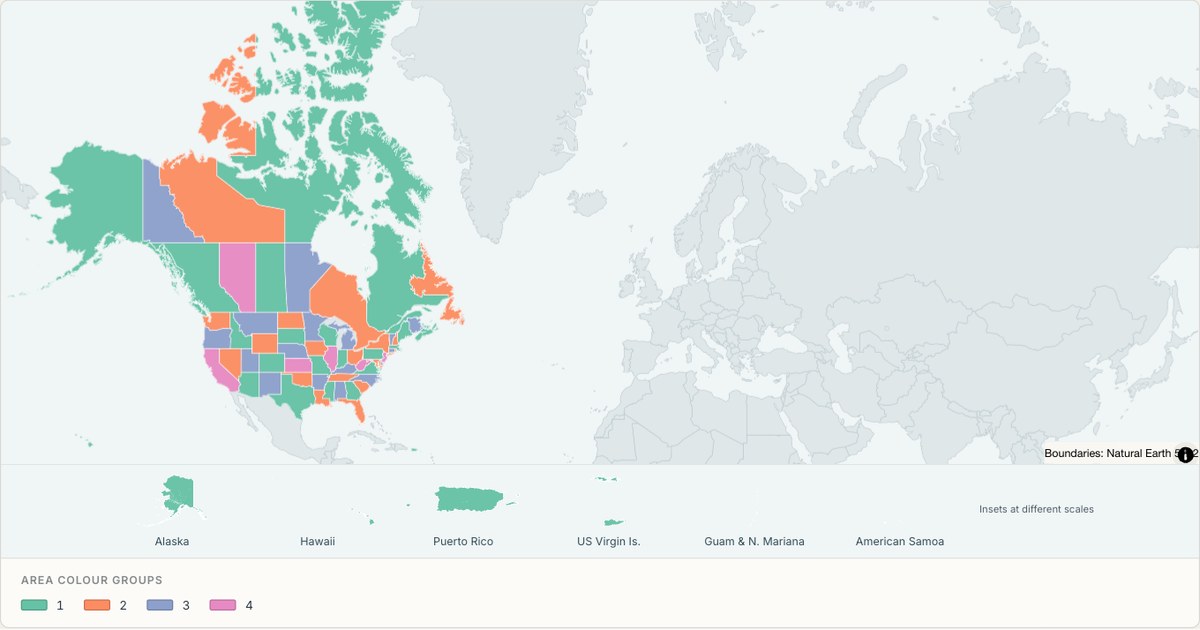 TopoJSONCategorical regions
United States and Canada
Explore 69 named areas in United States and Canada. Each boundary is selectable and carries a stable identifier, so you can add your own values or distinguish neighbouring areas with a categorical colour scheme.
Open map →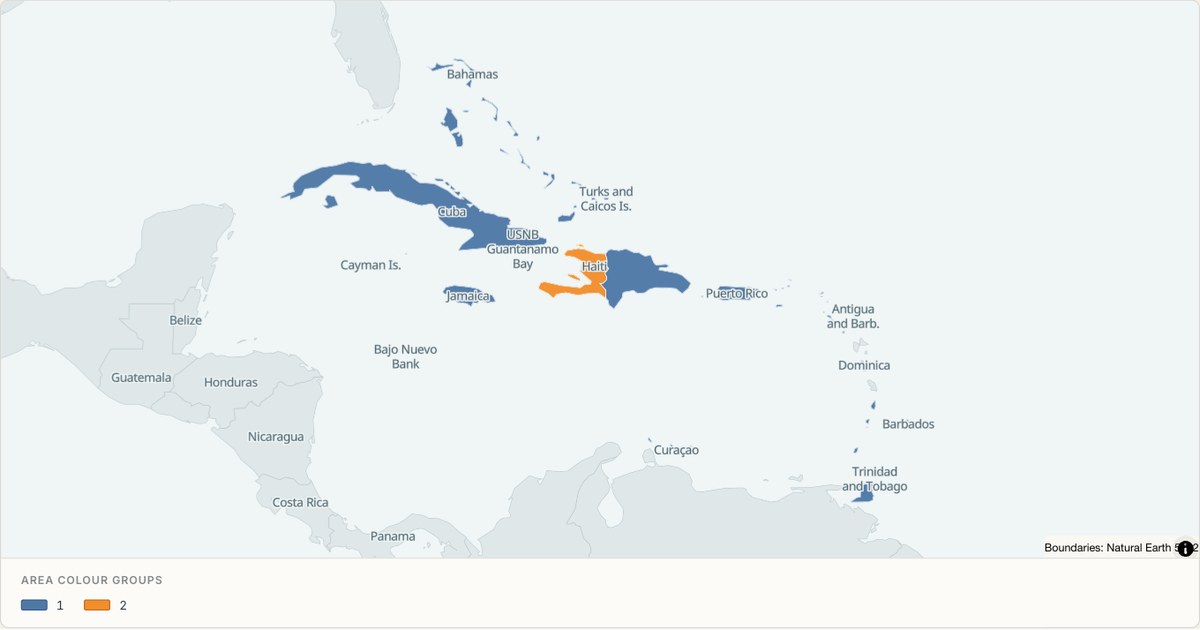 TopoJSONCategorical regions
Caribbean
Explore 28 named areas in Caribbean. Each boundary is selectable and carries a stable identifier, so you can add your own values or distinguish neighbouring areas with a categorical colour scheme.
Open map →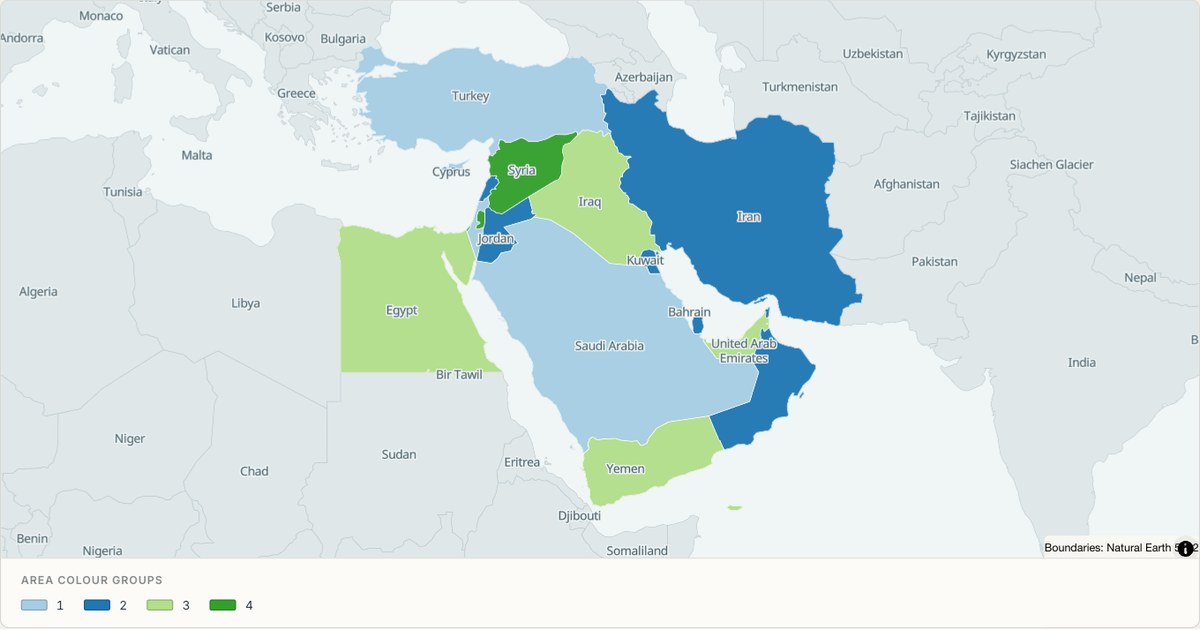 TopoJSONCategorical regions
Middle East
Explore 18 named areas in Middle East. Each boundary is selectable and carries a stable identifier, so you can add your own values or distinguish neighbouring areas with a categorical colour scheme.
Open map →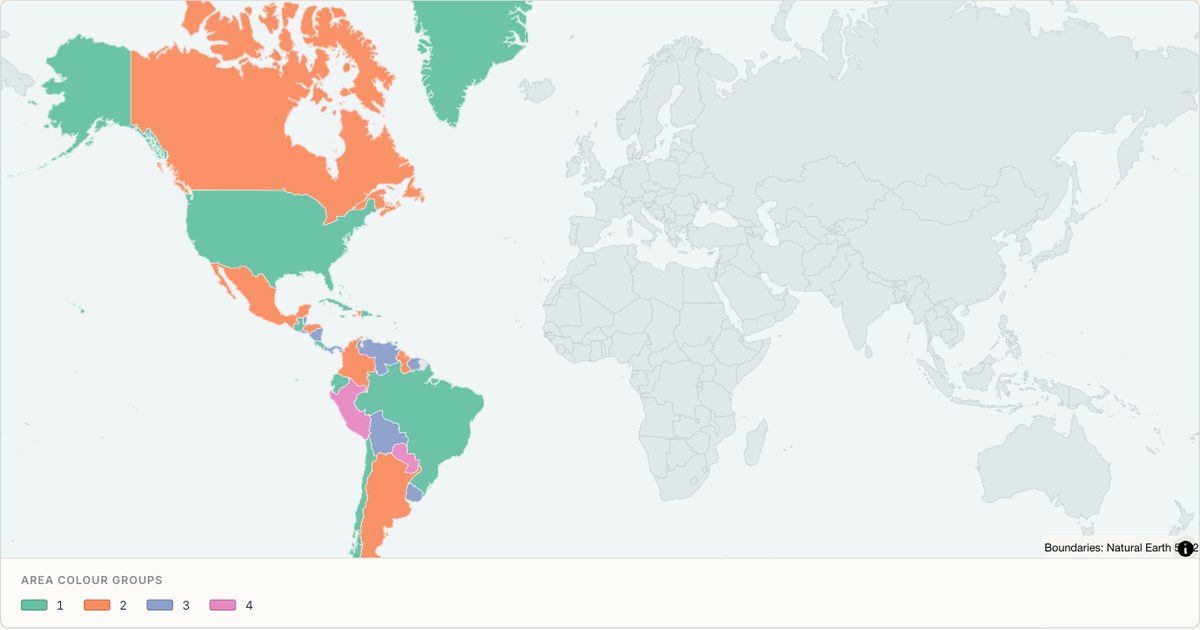 TopoJSONCategorical regions
The Americas
Explore 57 named areas in The Americas. Each boundary is selectable and carries a stable identifier, so you can add your own values or distinguish neighbouring areas with a categorical colour scheme.
Open map →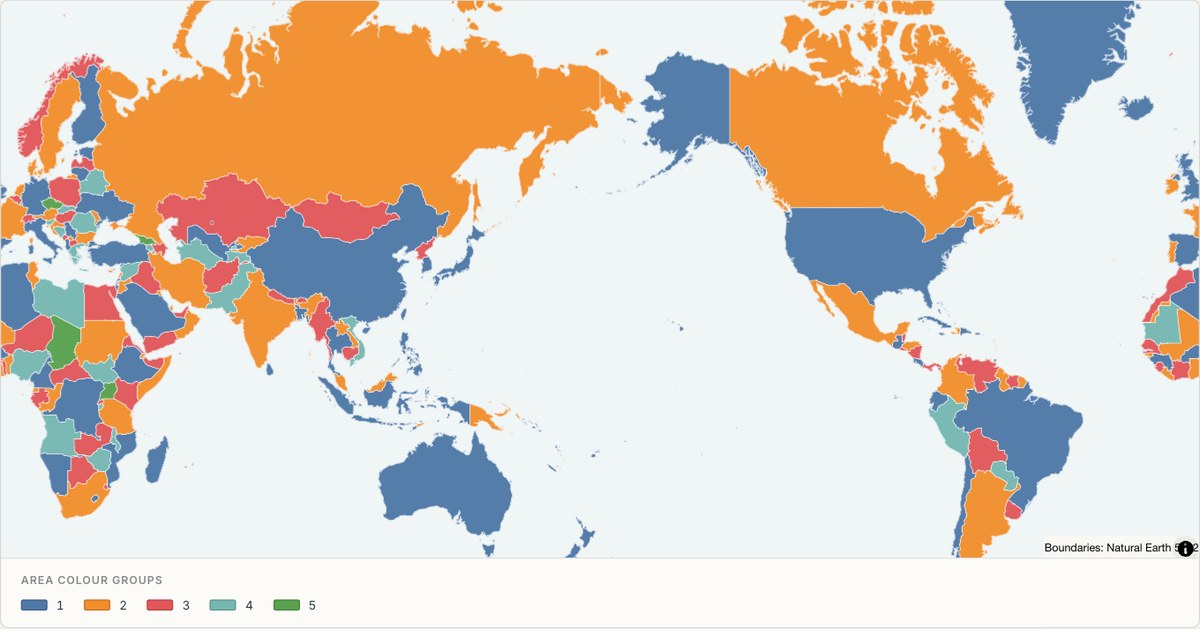 TopoJSONCategorical regions
World Pacific centred
Explore 257 named areas in World. Each boundary is selectable and carries a stable identifier, so you can add your own values or distinguish neighbouring areas with a categorical colour scheme.
Open map →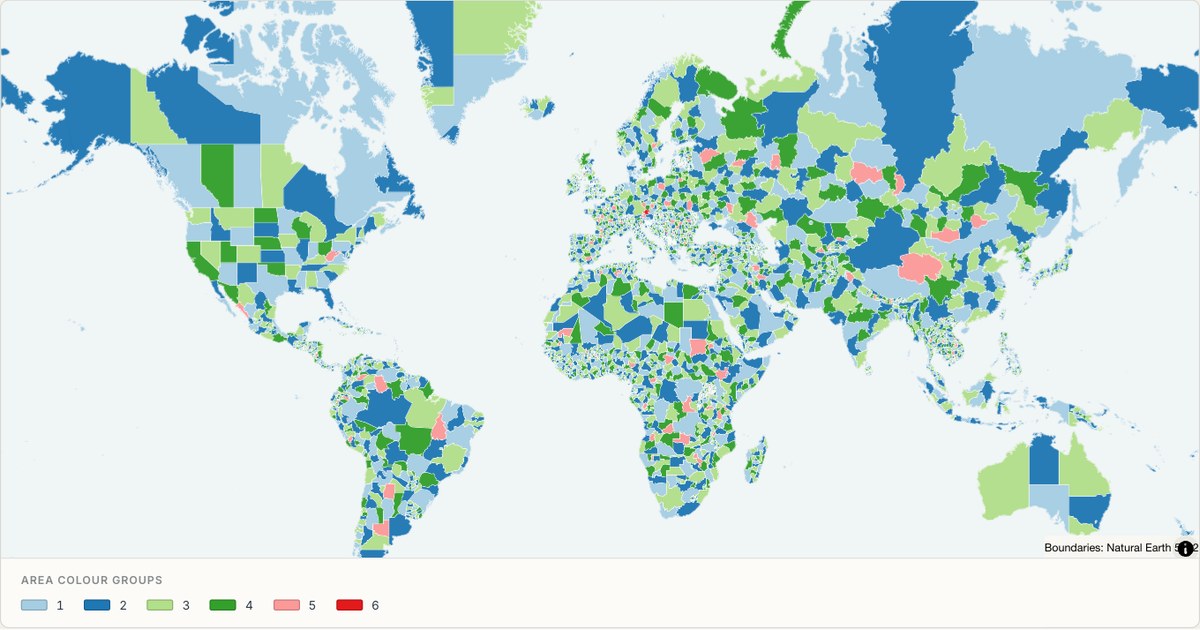 TopoJSONCategorical regions
World administrative divisions
Explore 4,594 named areas in World. Each boundary is selectable and carries a stable identifier, so you can add your own values or distinguish neighbouring areas with a categorical colour scheme.
Open map →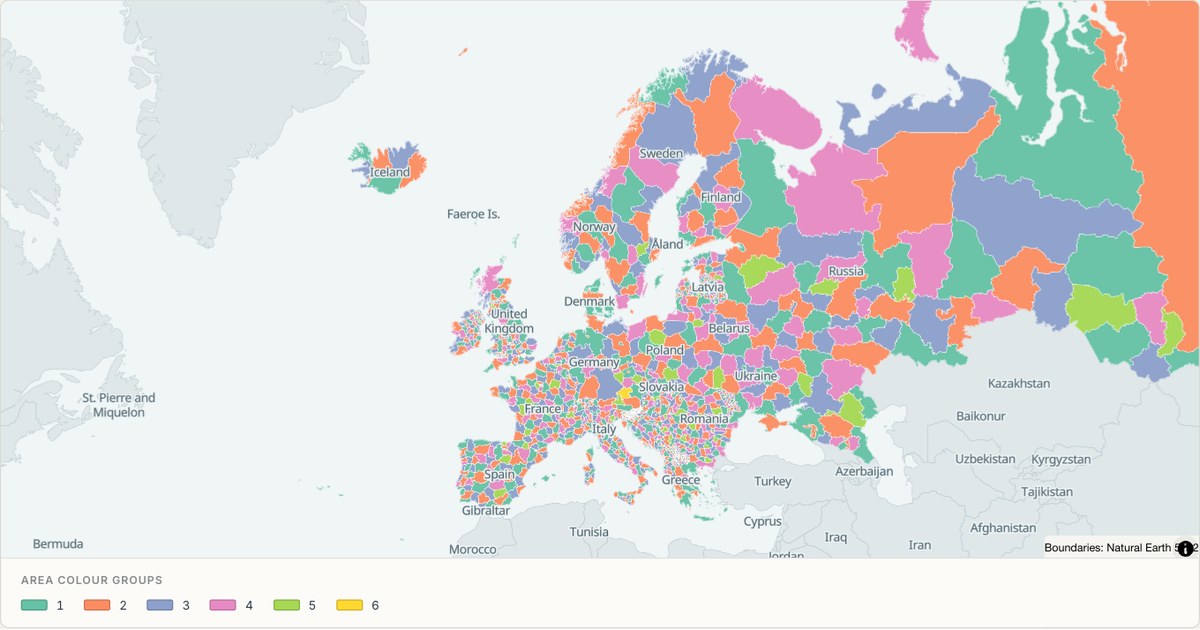 TopoJSONCategorical regions
Europe administrative divisions
Explore 1,687 named areas in Europe. Each boundary is selectable and carries a stable identifier, so you can add your own values or distinguish neighbouring areas with a categorical colour scheme.
Open map →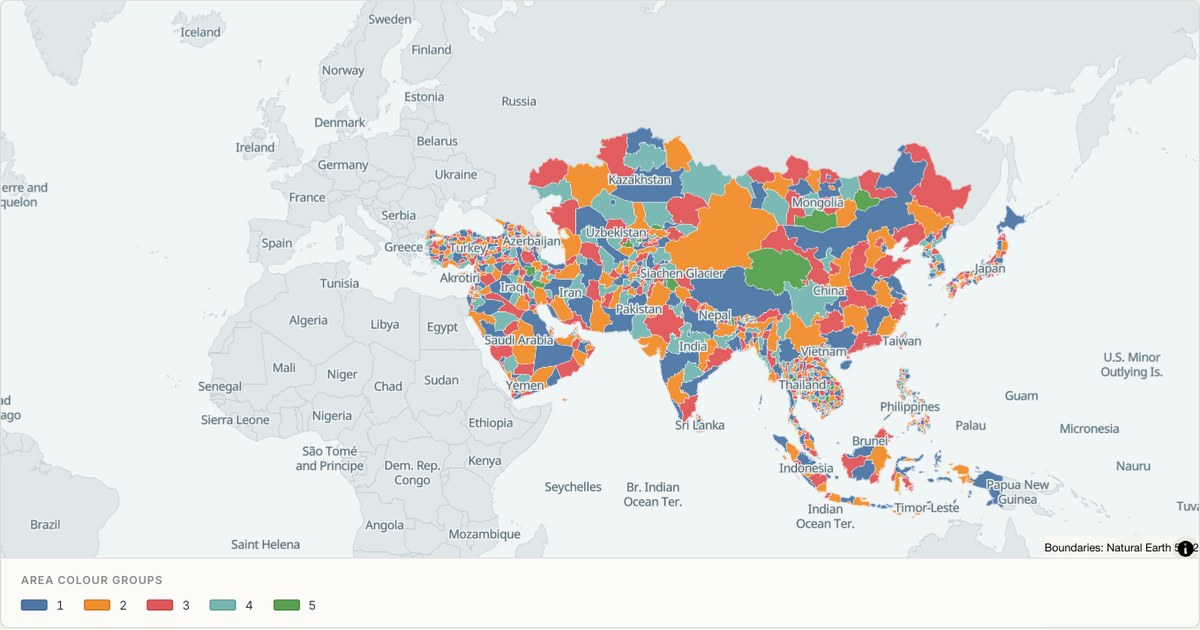 TopoJSONCategorical regions
Asia administrative divisions
Explore 1,124 named areas in Asia. Each boundary is selectable and carries a stable identifier, so you can add your own values or distinguish neighbouring areas with a categorical colour scheme.
Open map →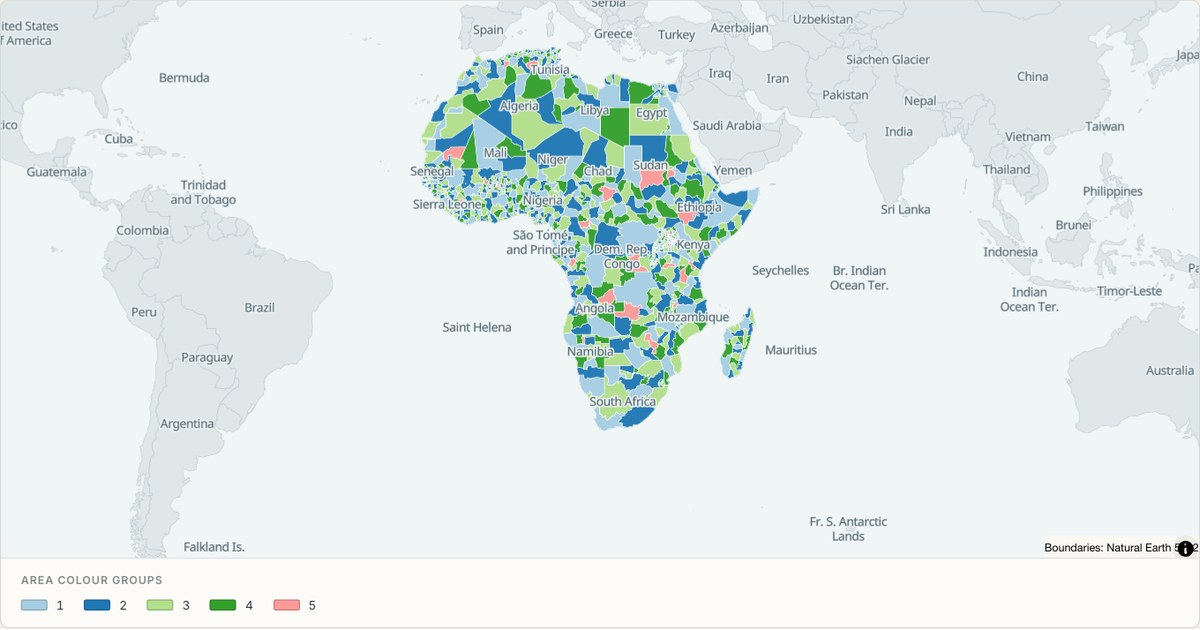 TopoJSONCategorical regions
Africa administrative divisions
Explore 923 named areas in Africa. Each boundary is selectable and carries a stable identifier, so you can add your own values or distinguish neighbouring areas with a categorical colour scheme.
Open map →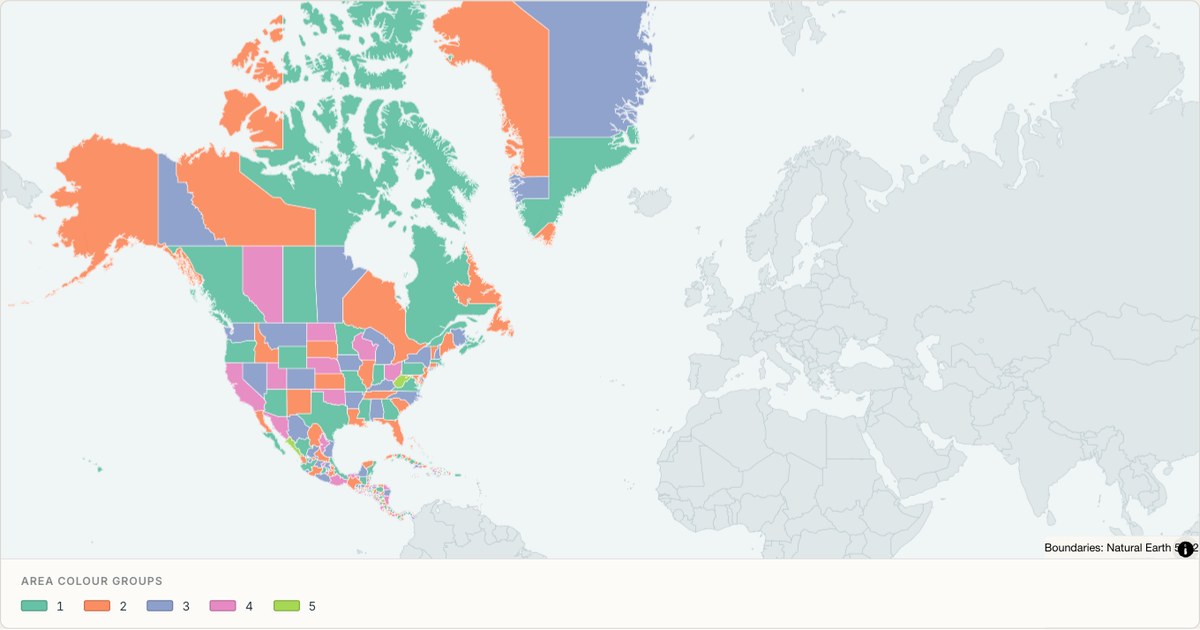 TopoJSONCategorical regions
North America administrative divisions
Explore 441 named areas in North America. Each boundary is selectable and carries a stable identifier, so you can add your own values or distinguish neighbouring areas with a categorical colour scheme.
Open map →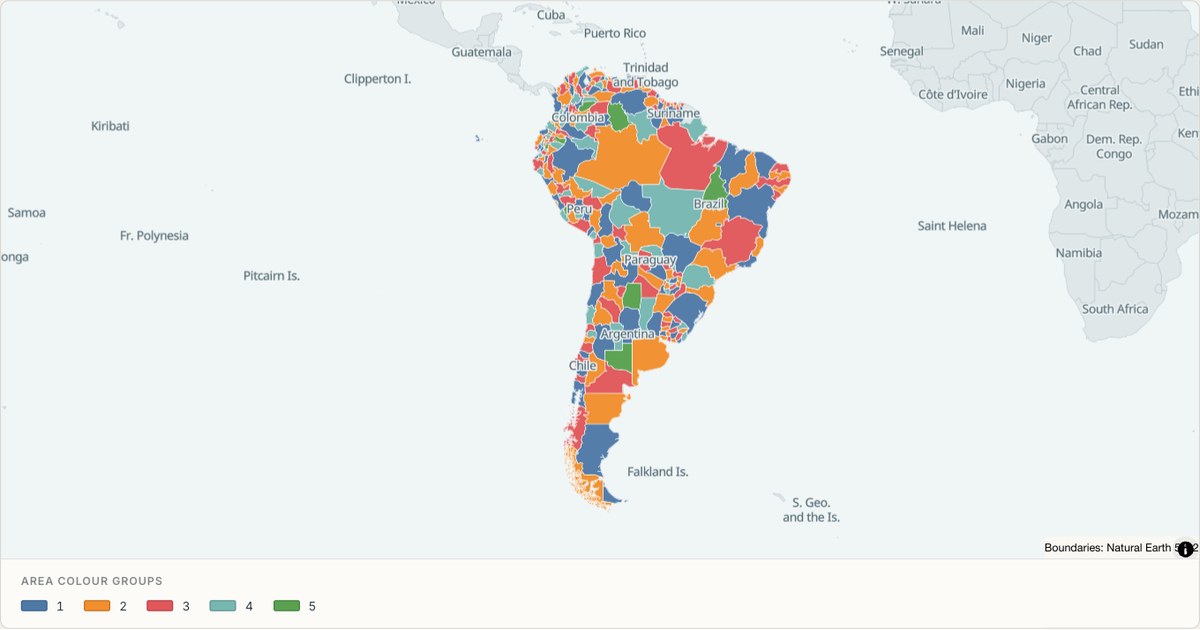 TopoJSONCategorical regions
South America administrative divisions
Explore 244 named areas in South America. Each boundary is selectable and carries a stable identifier, so you can add your own values or distinguish neighbouring areas with a categorical colour scheme.
Open map →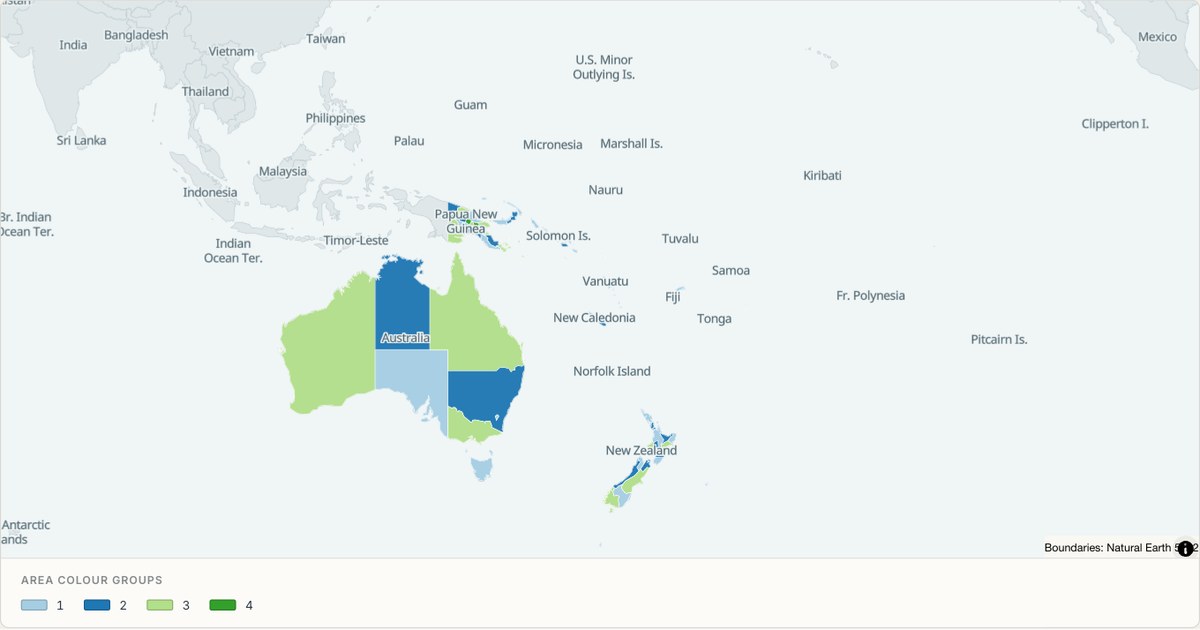 TopoJSONCategorical regions
Oceania administrative divisions
Explore 168 named areas in Oceania. Each boundary is selectable and carries a stable identifier, so you can add your own values or distinguish neighbouring areas with a categorical colour scheme.
Open map →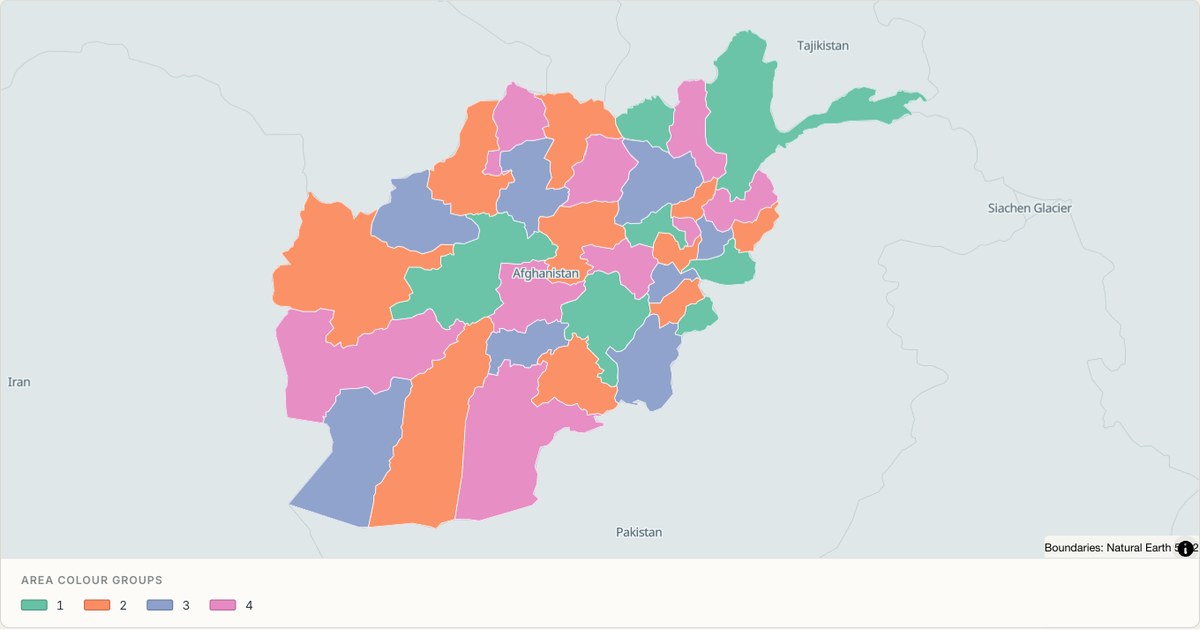 TopoJSONCategorical regions
Afghanistan administrative map
Explore 34 named areas in Afghanistan. Each boundary is selectable and carries a stable identifier, so you can add your own values or distinguish neighbouring areas with a categorical colour scheme.
Open map →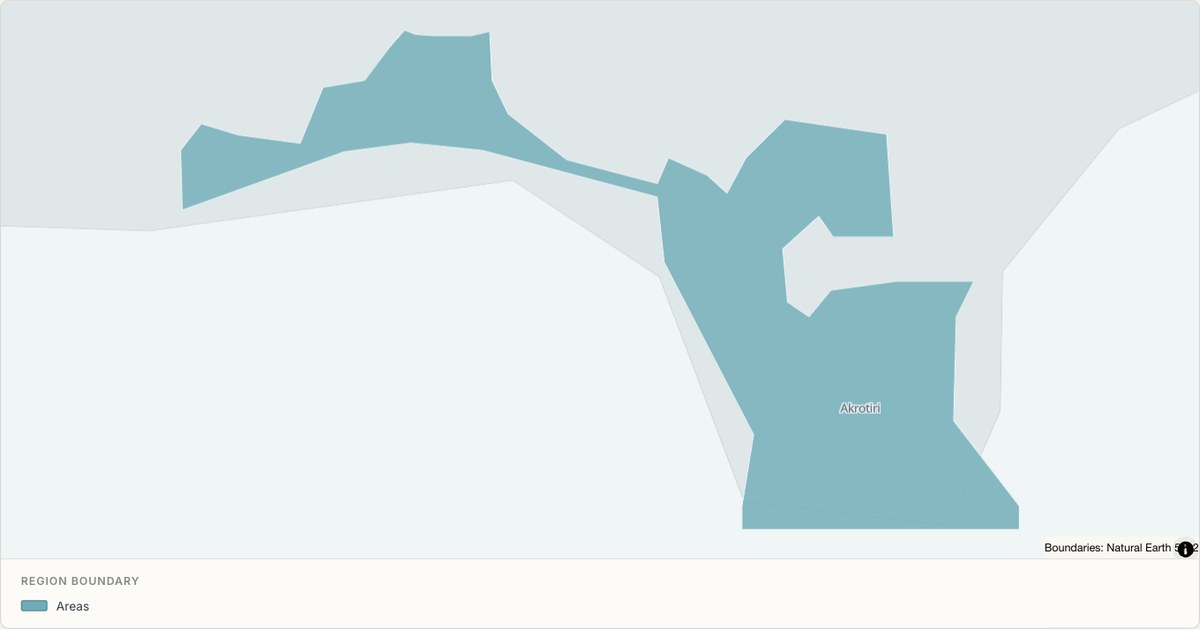 TopoJSONSingle boundary
Akrotiri Sovereign Base Area boundary map
Explore the boundary supplied for Akrotiri Sovereign Base Area. This snapshot contains one feature and does not provide internal subdivisions. Inspect its identifier and source attributes, or use it as a starting outline for your own map.
Open map →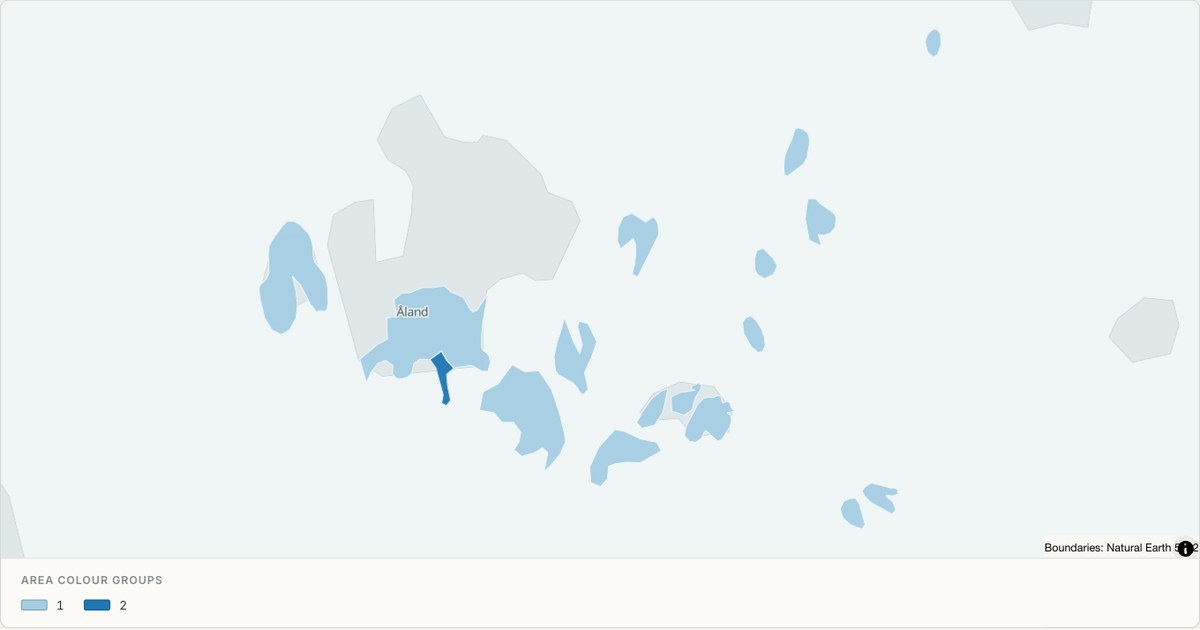 TopoJSONCategorical regions
Aland administrative map
Explore 11 named areas in Aland. Each boundary is selectable and carries a stable identifier, so you can add your own values or distinguish neighbouring areas with a categorical colour scheme.
Open map →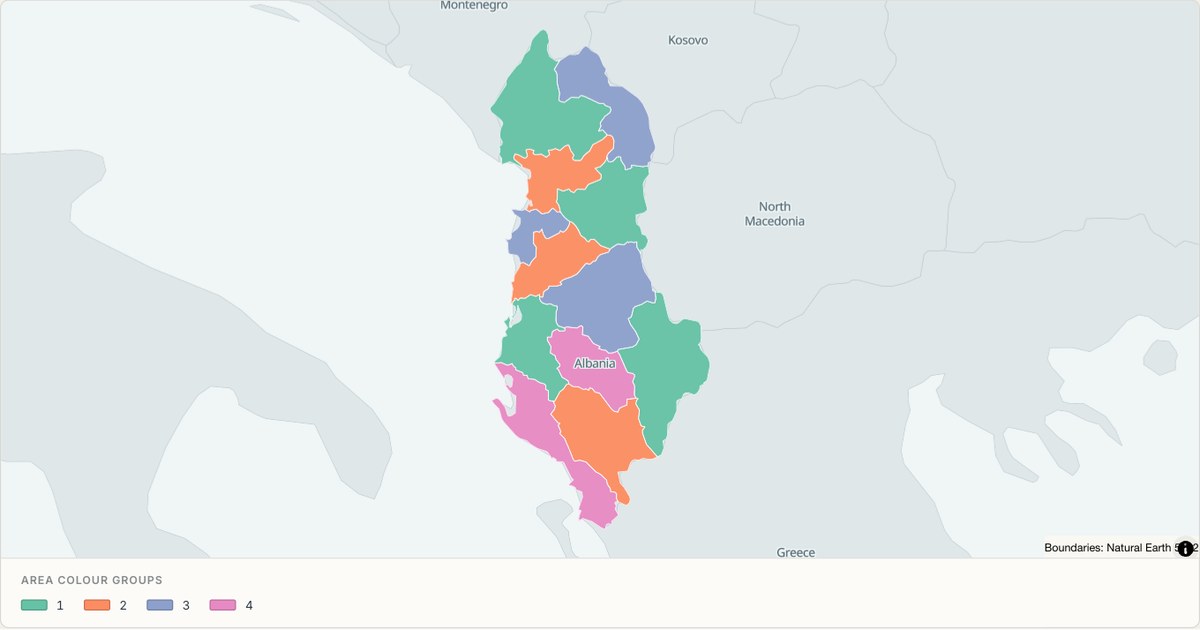 TopoJSONCategorical regions
Albania administrative map
Explore 12 named areas in Albania. Each boundary is selectable and carries a stable identifier, so you can add your own values or distinguish neighbouring areas with a categorical colour scheme.
Open map →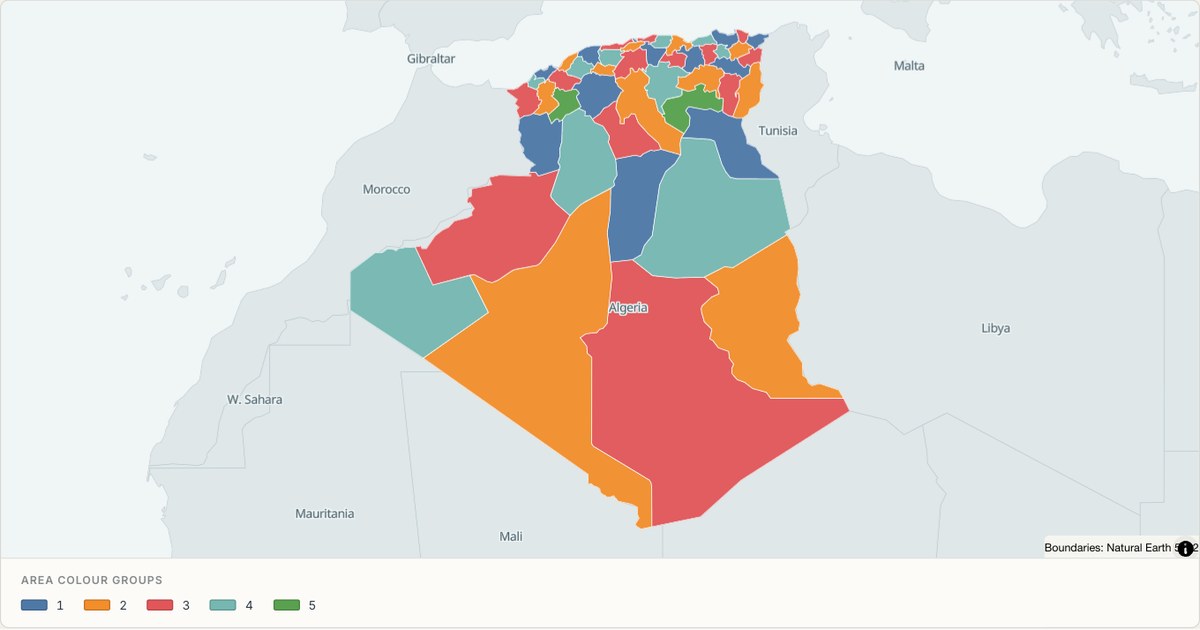 TopoJSONCategorical regions
Algeria administrative map
Explore 48 named areas in Algeria. Each boundary is selectable and carries a stable identifier, so you can add your own values or distinguish neighbouring areas with a categorical colour scheme.
Open map →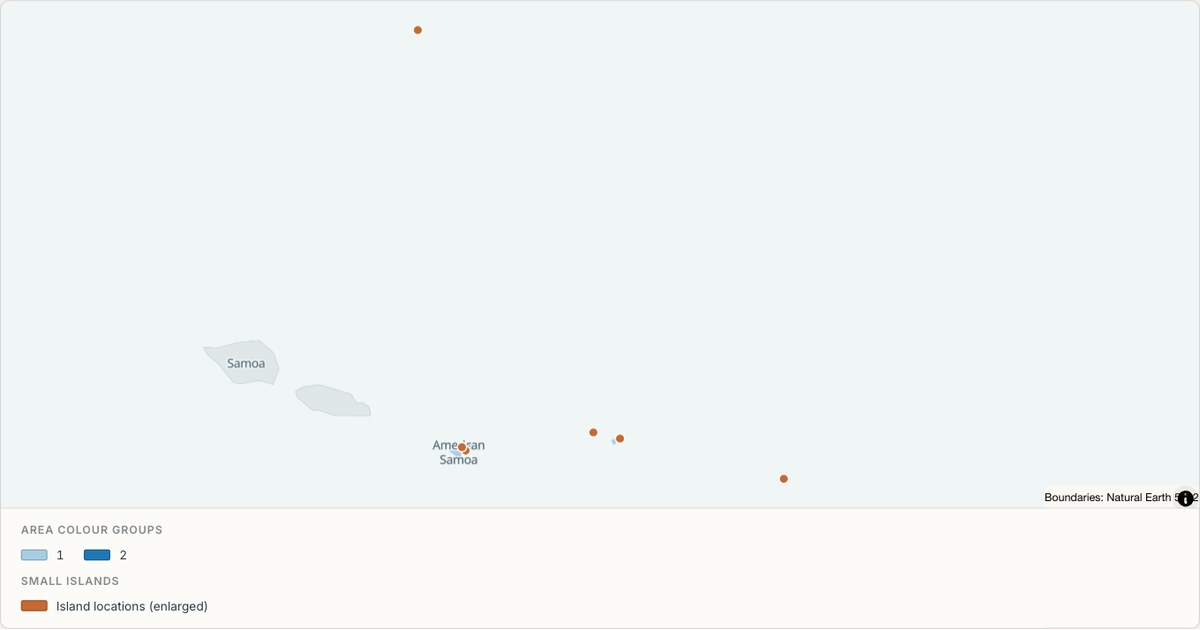 TopoJSONCategorical regions
American Samoa administrative map
Explore 5 named areas in American Samoa. Each boundary is selectable and carries a stable identifier, so you can add your own values or distinguish neighbouring areas with a categorical colour scheme.
Open map →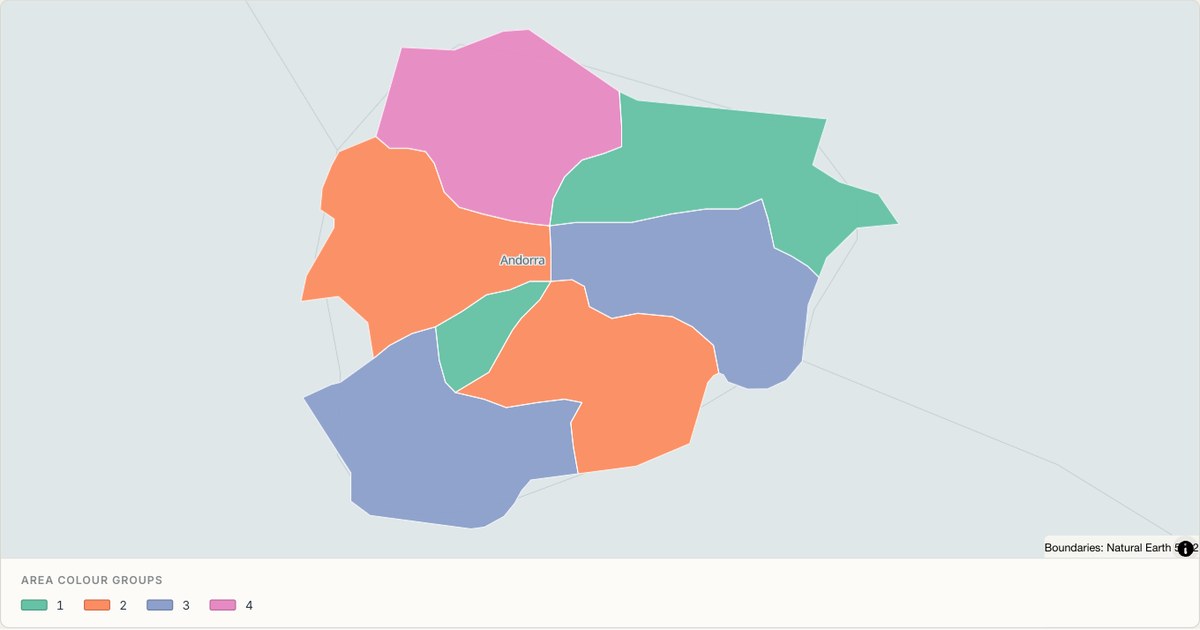 TopoJSONCategorical regions
Andorra administrative map
Explore 7 named areas in Andorra. Each boundary is selectable and carries a stable identifier, so you can add your own values or distinguish neighbouring areas with a categorical colour scheme.
Open map →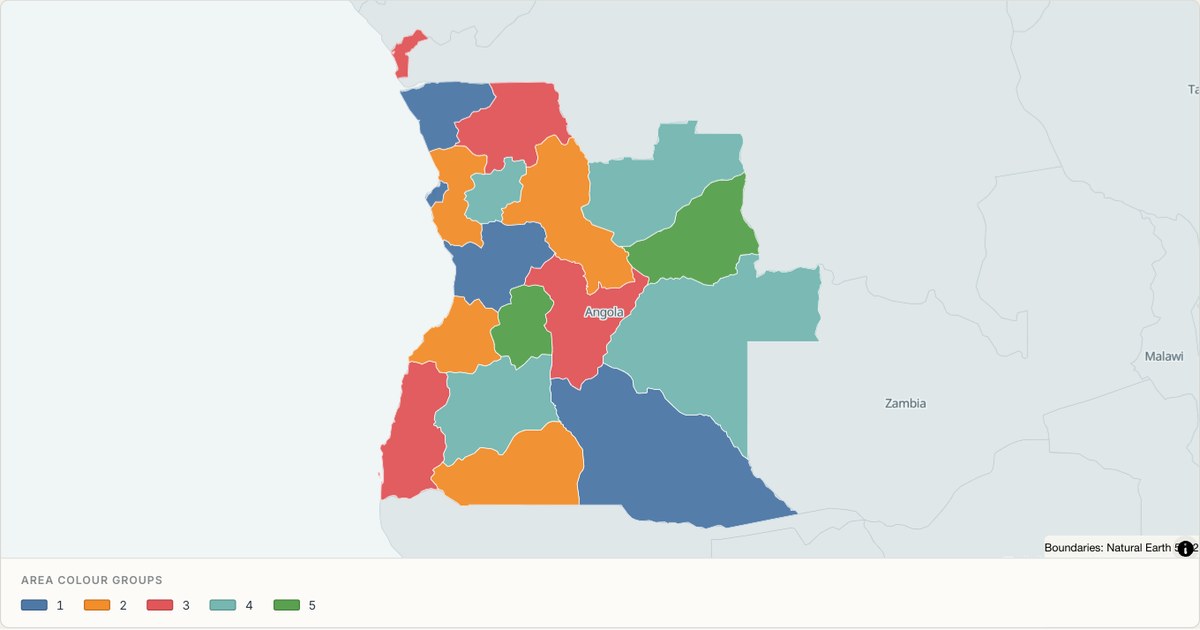 TopoJSONCategorical regions
Angola administrative map
Explore 18 named areas in Angola. Each boundary is selectable and carries a stable identifier, so you can add your own values or distinguish neighbouring areas with a categorical colour scheme.
Open map →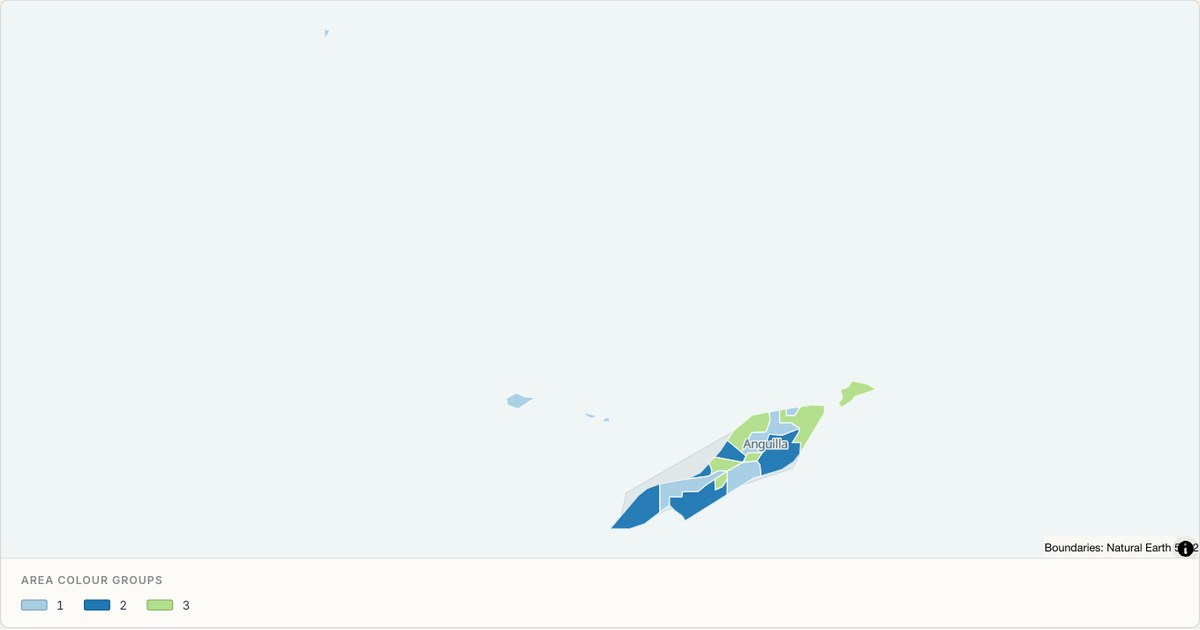 TopoJSONCategorical regions
Anguilla administrative map
Explore 15 named areas in Anguilla. Each boundary is selectable and carries a stable identifier, so you can add your own values or distinguish neighbouring areas with a categorical colour scheme.
Open map →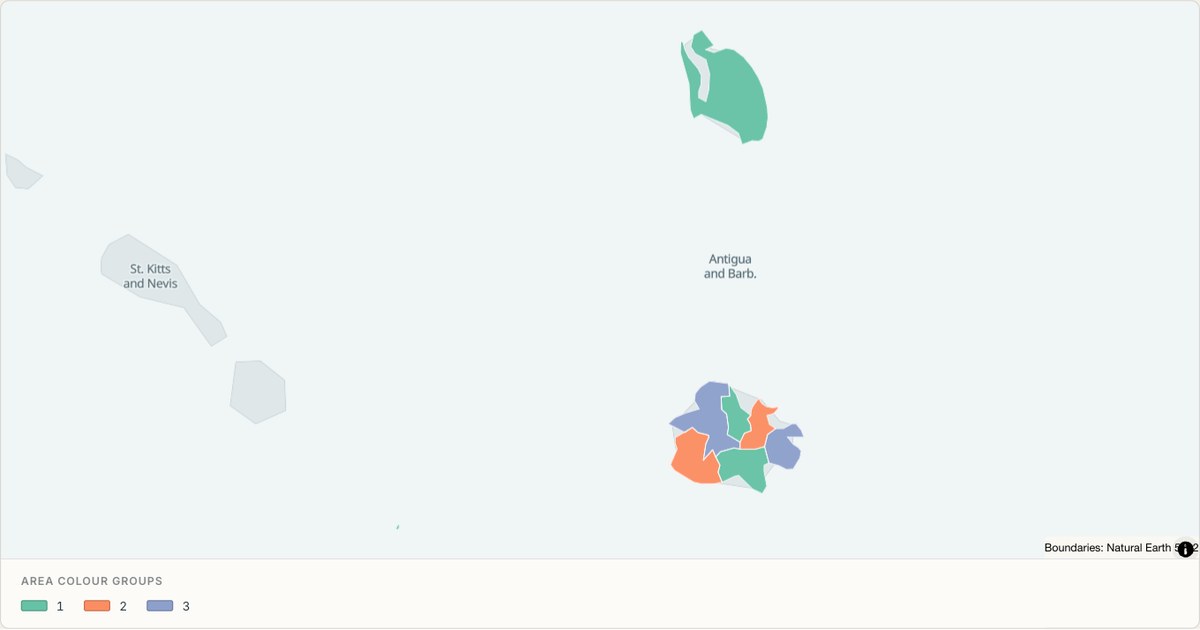 TopoJSONCategorical regions
Antigua and Barbuda administrative map
Explore 8 named areas in Antigua and Barbuda. Each boundary is selectable and carries a stable identifier, so you can add your own values or distinguish neighbouring areas with a categorical colour scheme.
Open map →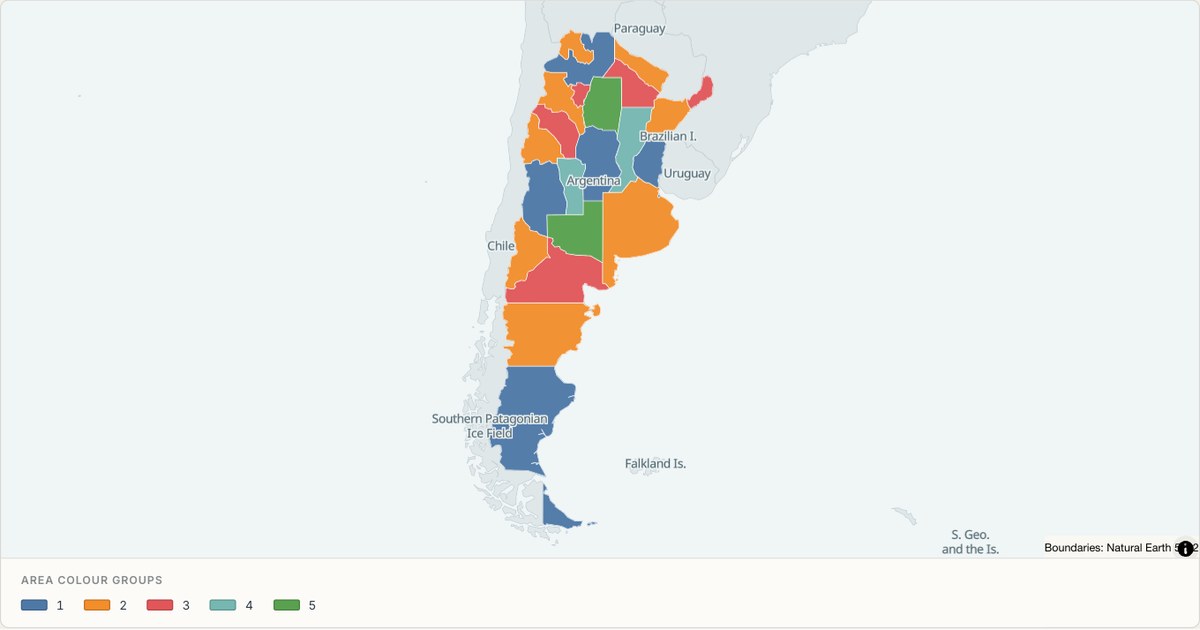 TopoJSONCategorical regions
Argentina administrative map
Explore 24 named areas in Argentina. Each boundary is selectable and carries a stable identifier, so you can add your own values or distinguish neighbouring areas with a categorical colour scheme.
Open map →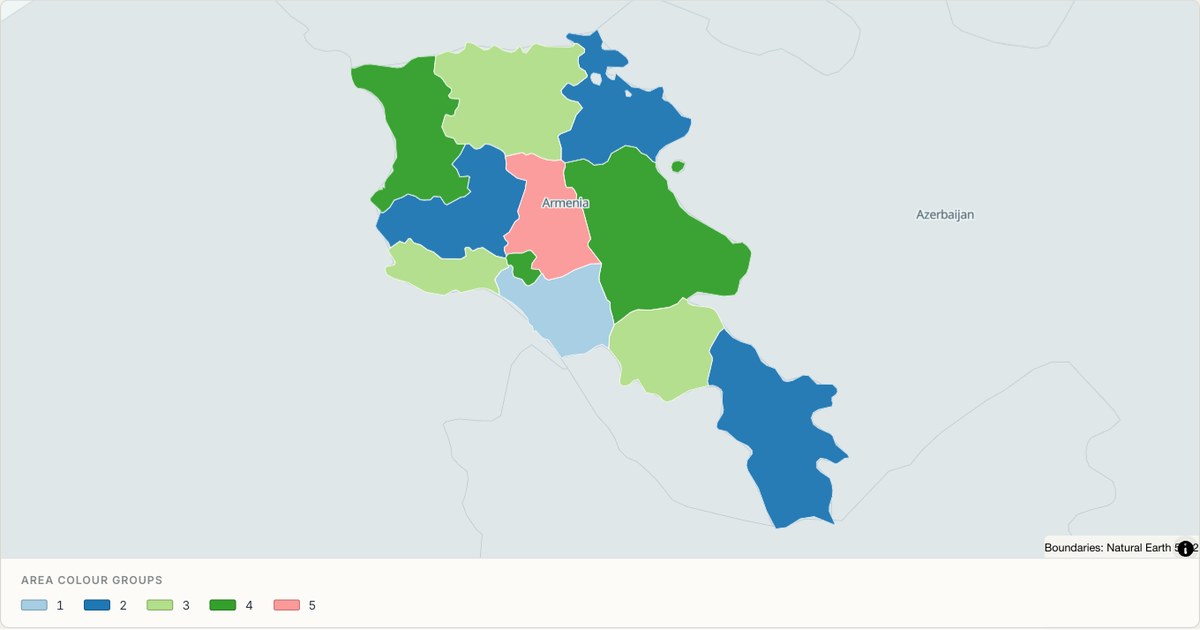 TopoJSONCategorical regions
Armenia administrative map
Explore 11 named areas in Armenia. Each boundary is selectable and carries a stable identifier, so you can add your own values or distinguish neighbouring areas with a categorical colour scheme.
Open map →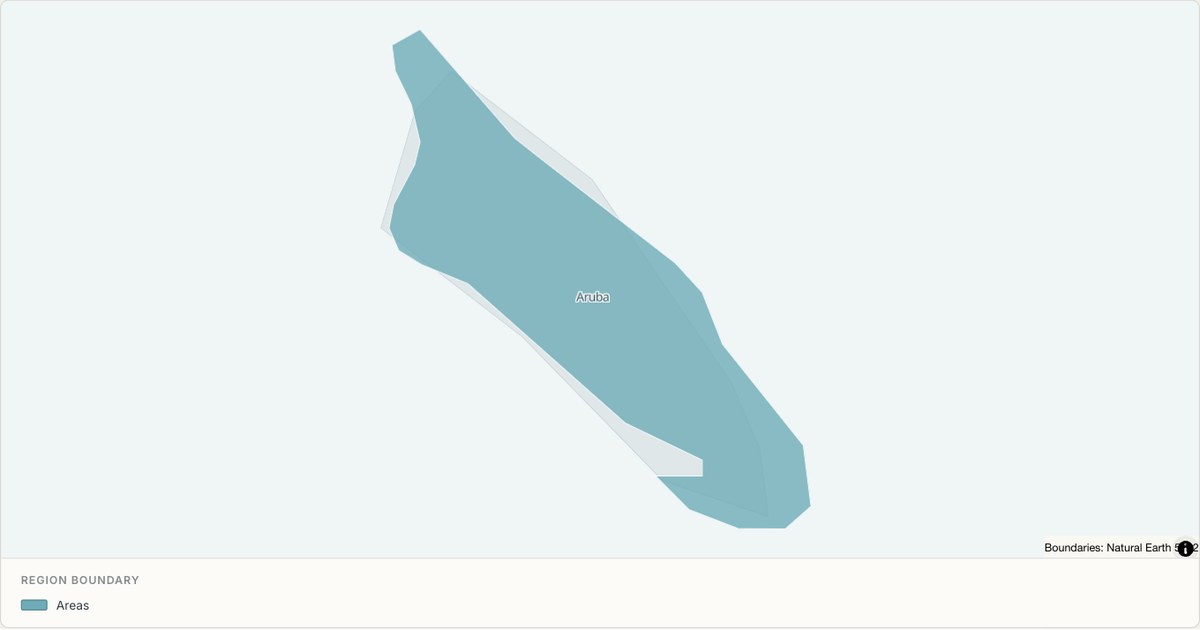 TopoJSONSingle boundary
Aruba boundary map
Explore the boundary supplied for Aruba. This snapshot contains one feature and does not provide internal subdivisions. Inspect its identifier and source attributes, or use it as a starting outline for your own map.
Open map → TopoJSONSingle boundary
Ashmore and Cartier Islands boundary map
Explore the boundary supplied for Ashmore and Cartier Islands. This snapshot contains one feature and does not provide internal subdivisions. Inspect its identifier and source attributes, or use it as a starting outline for your own map.
Open map →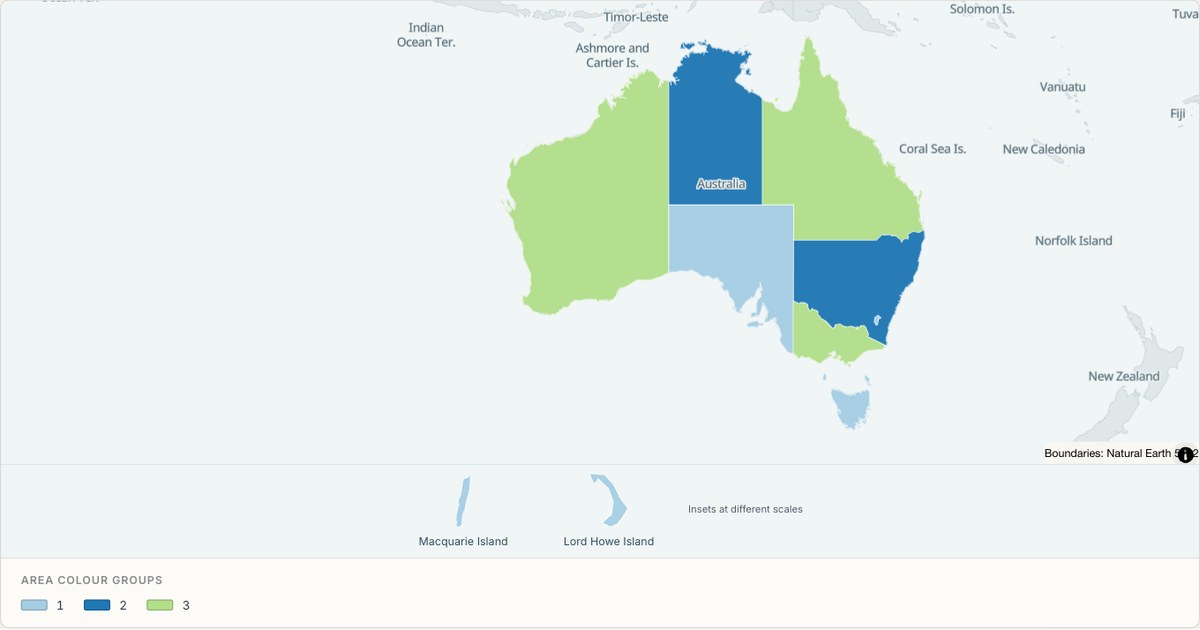 TopoJSONCategorical regions
Australia administrative map
Explore 11 named areas in Australia. Each boundary is selectable and carries a stable identifier, so you can add your own values or distinguish neighbouring areas with a categorical colour scheme.
Open map →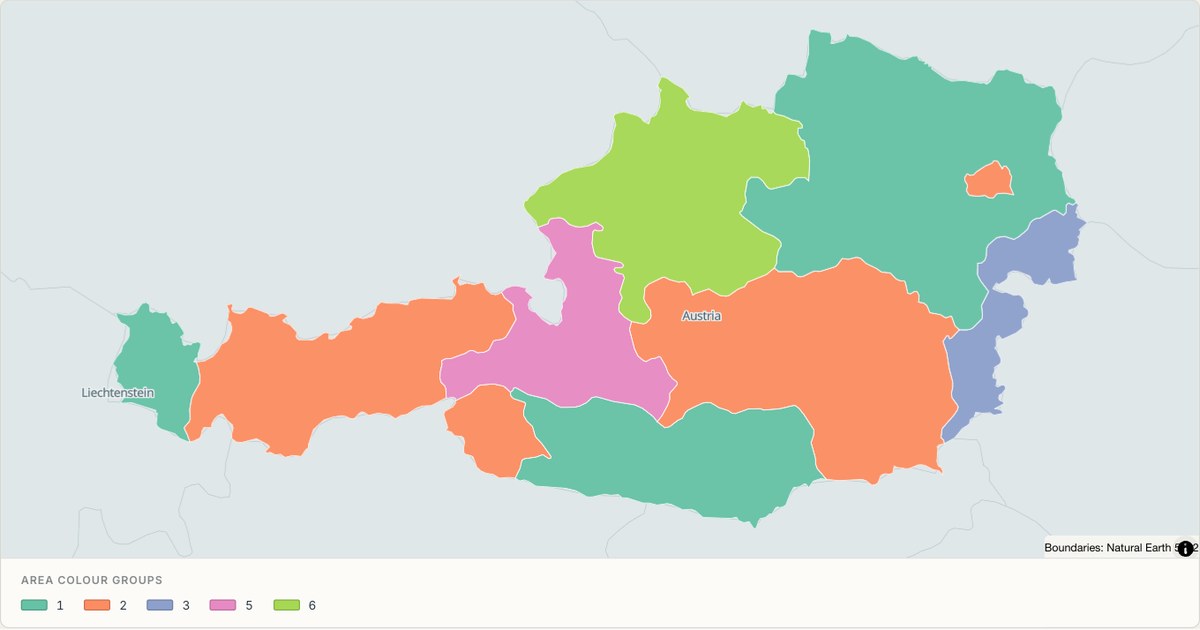 TopoJSONCategorical regions
Austria administrative map
Explore 9 named areas in Austria. Each boundary is selectable and carries a stable identifier, so you can add your own values or distinguish neighbouring areas with a categorical colour scheme.
Open map →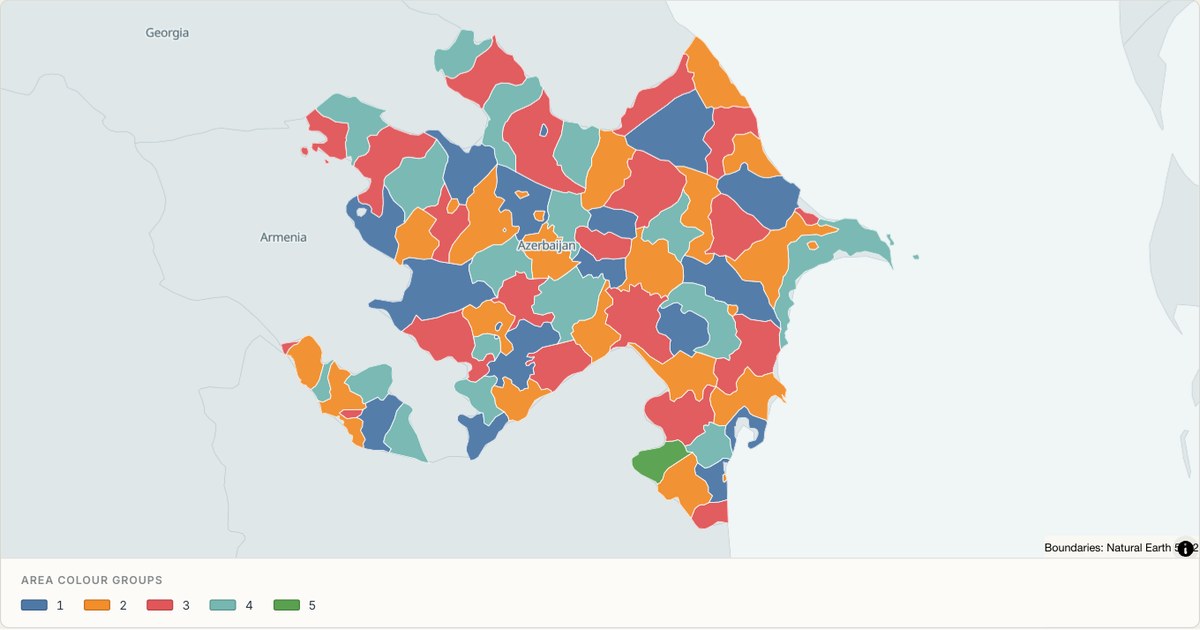 TopoJSONCategorical regions
Azerbaijan administrative map
Explore 78 named areas in Azerbaijan. Each boundary is selectable and carries a stable identifier, so you can add your own values or distinguish neighbouring areas with a categorical colour scheme.
Open map →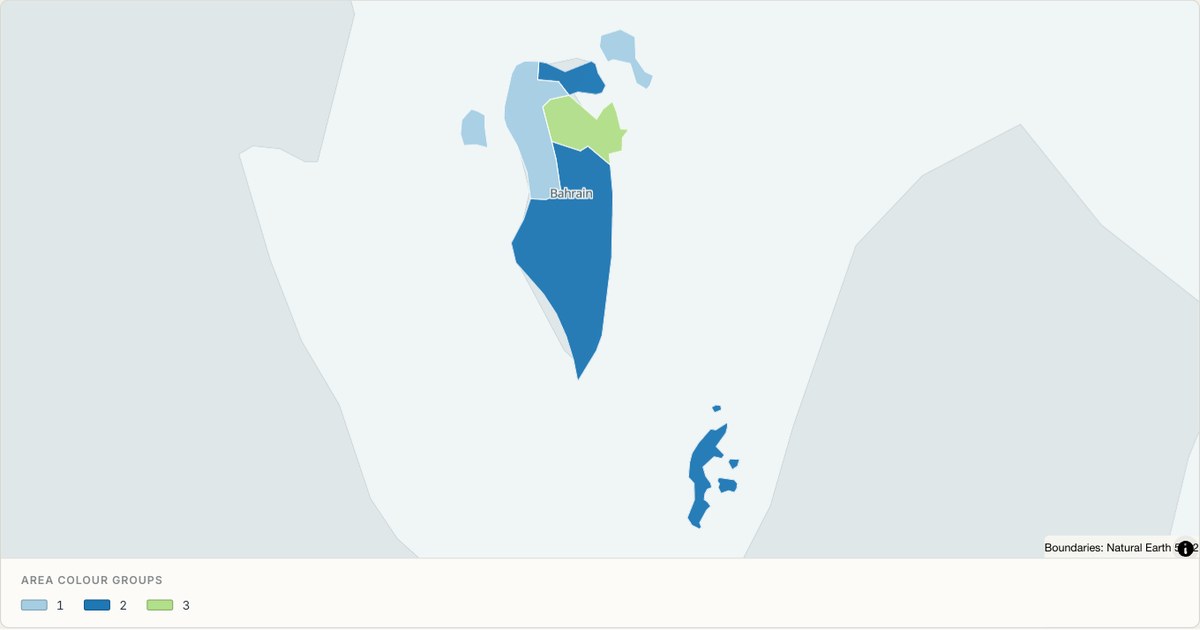 TopoJSONCategorical regions
Bahrain administrative map
Explore 5 named areas in Bahrain. Each boundary is selectable and carries a stable identifier, so you can add your own values or distinguish neighbouring areas with a categorical colour scheme.
Open map →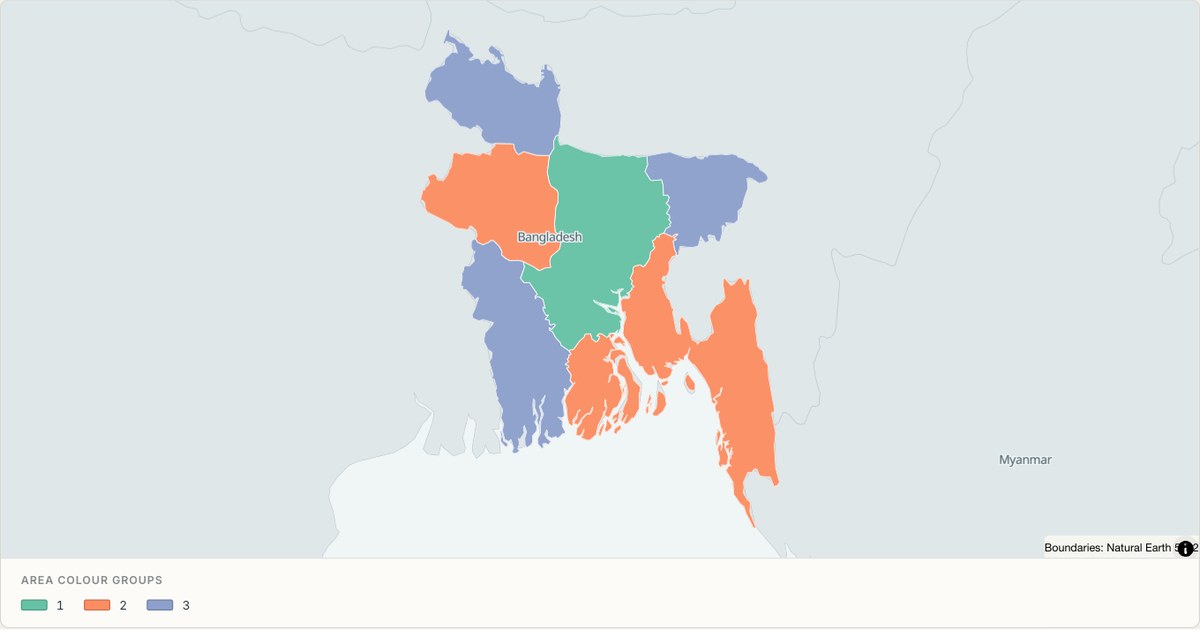 TopoJSONCategorical regions
Bangladesh administrative map
Explore 7 named areas in Bangladesh. Each boundary is selectable and carries a stable identifier, so you can add your own values or distinguish neighbouring areas with a categorical colour scheme.
Open map →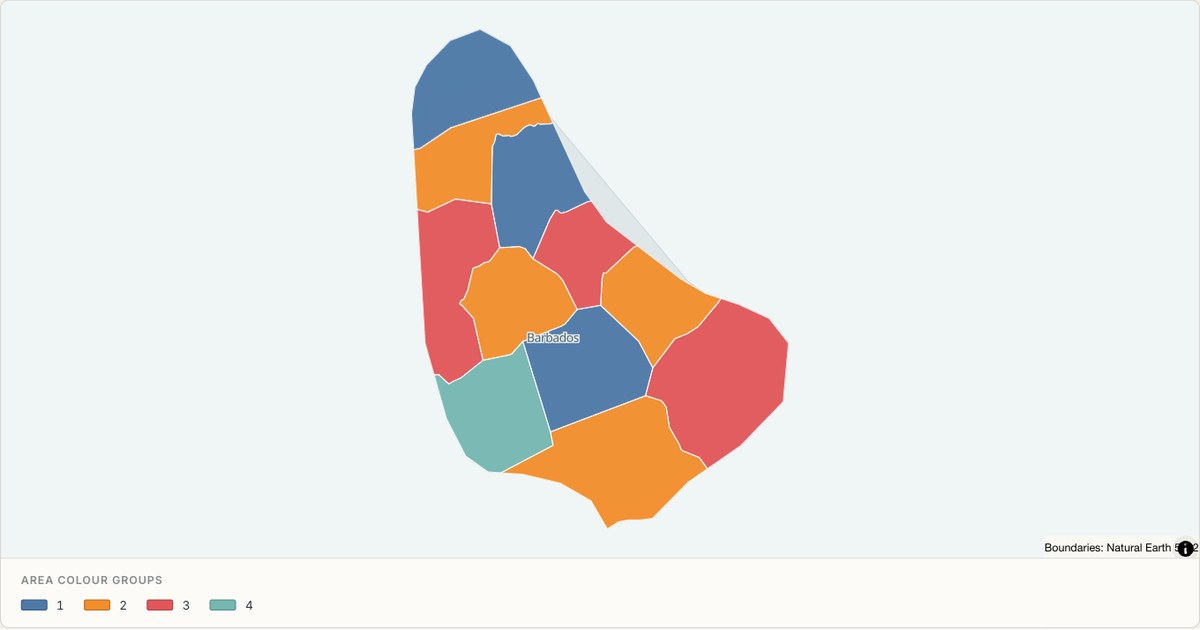 TopoJSONCategorical regions
Barbados administrative map
Explore 11 named areas in Barbados. Each boundary is selectable and carries a stable identifier, so you can add your own values or distinguish neighbouring areas with a categorical colour scheme.
Open map → TopoJSONSingle boundary
Baykonur Cosmodrome boundary map
Explore the boundary supplied for Baykonur Cosmodrome. This snapshot contains one feature and does not provide internal subdivisions. Inspect its identifier and source attributes, or use it as a starting outline for your own map.
Open map →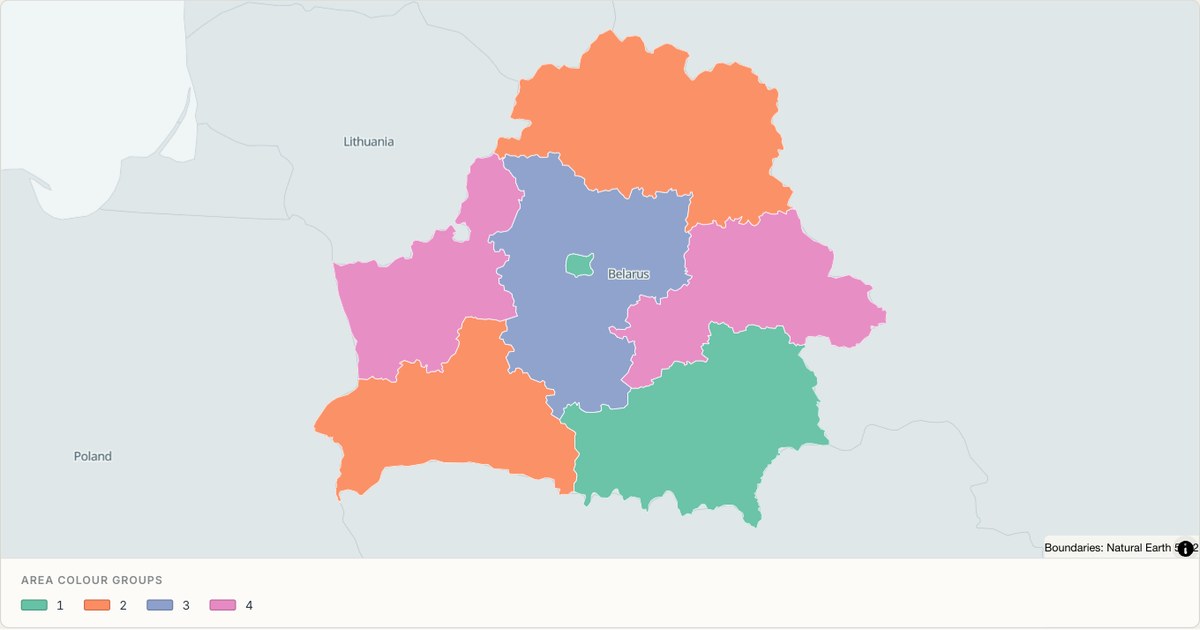 TopoJSONCategorical regions
Belarus administrative map
Explore 7 named areas in Belarus. Each boundary is selectable and carries a stable identifier, so you can add your own values or distinguish neighbouring areas with a categorical colour scheme.
Open map →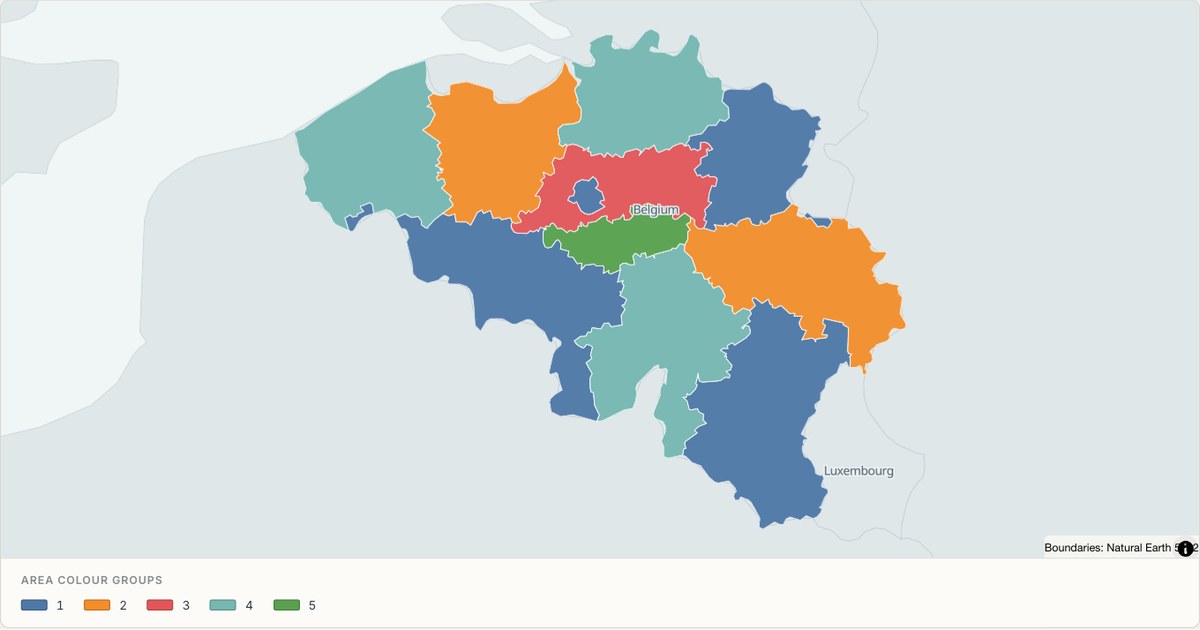 TopoJSONCategorical regions
Belgium administrative map
Explore 11 named areas in Belgium. Each boundary is selectable and carries a stable identifier, so you can add your own values or distinguish neighbouring areas with a categorical colour scheme.
Open map →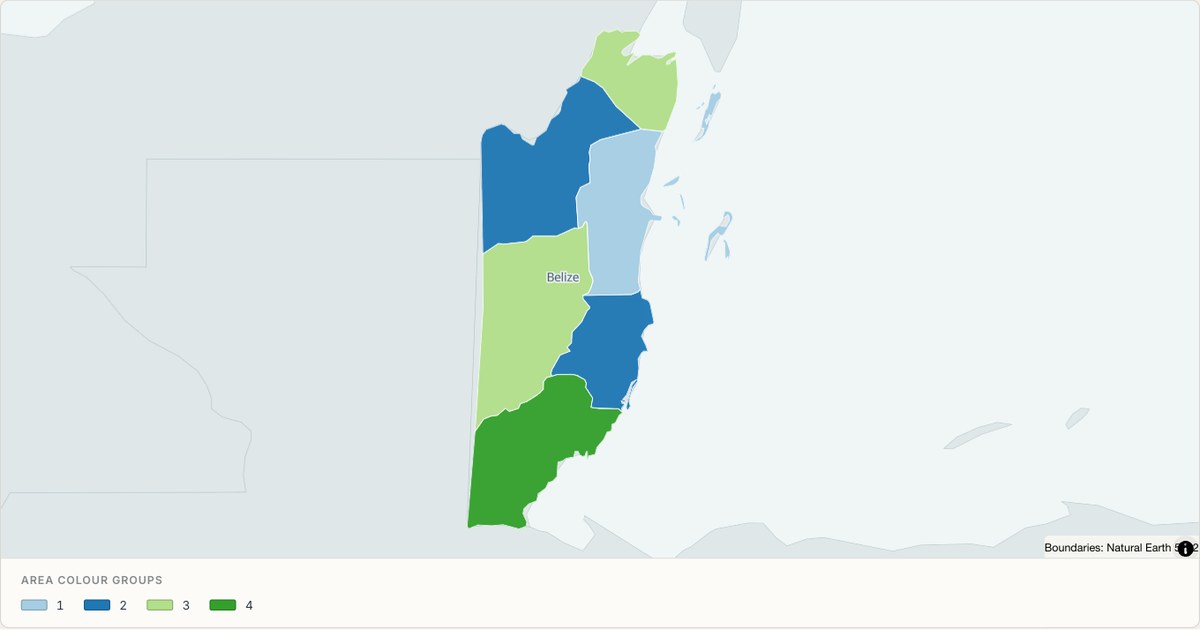 TopoJSONCategorical regions
Belize administrative map
Explore 6 named areas in Belize. Each boundary is selectable and carries a stable identifier, so you can add your own values or distinguish neighbouring areas with a categorical colour scheme.
Open map →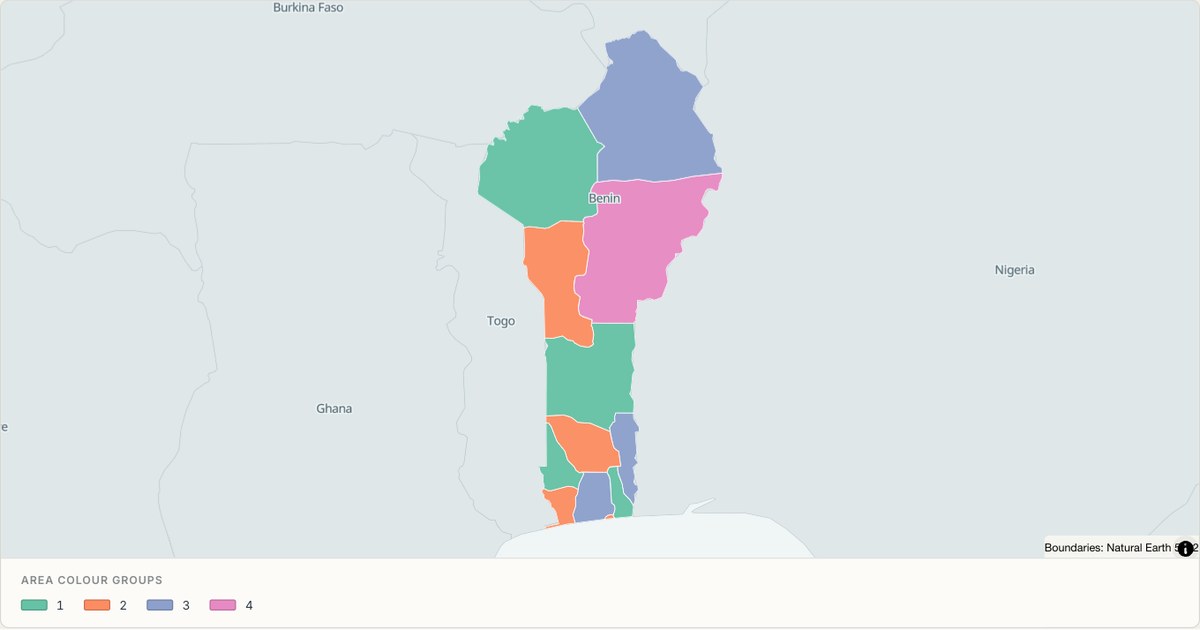 TopoJSONCategorical regions
Benin administrative map
Explore 12 named areas in Benin. Each boundary is selectable and carries a stable identifier, so you can add your own values or distinguish neighbouring areas with a categorical colour scheme.
Open map →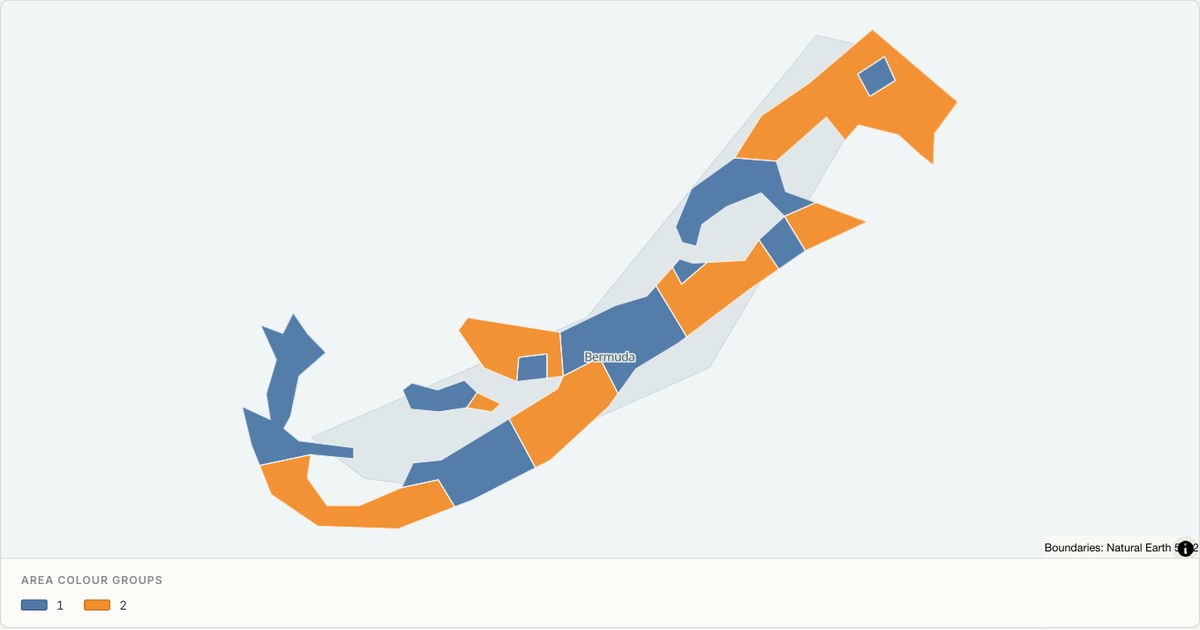 TopoJSONCategorical regions
Bermuda administrative map
Explore 11 named areas in Bermuda. Each boundary is selectable and carries a stable identifier, so you can add your own values or distinguish neighbouring areas with a categorical colour scheme.
Open map →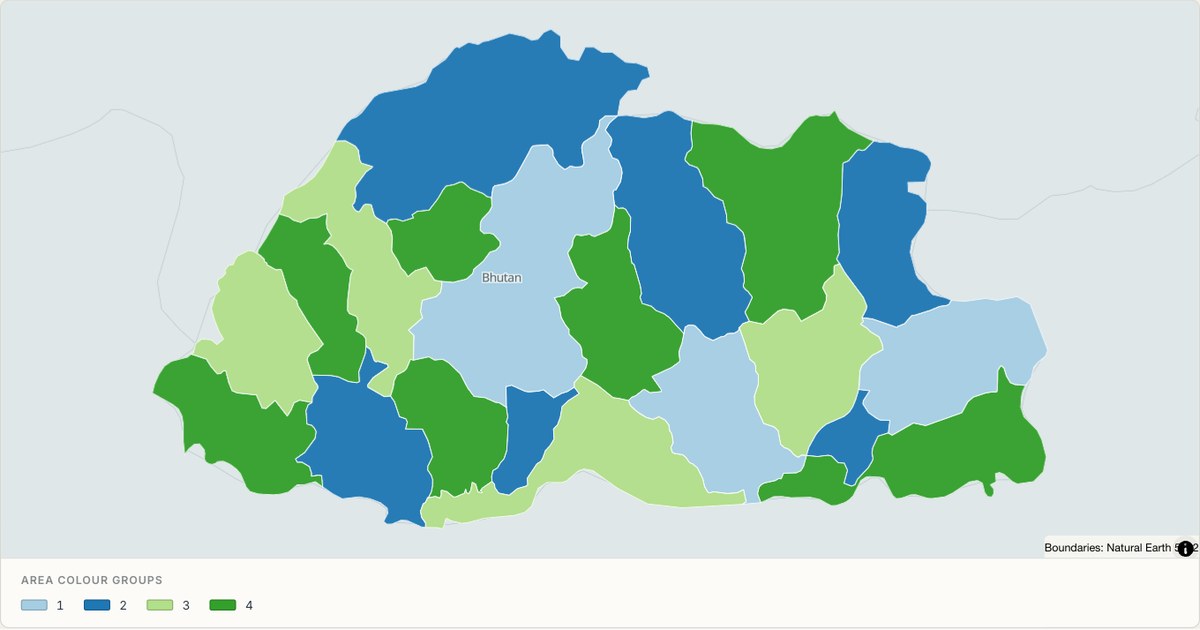 TopoJSONCategorical regions
Bhutan administrative map
Explore 20 named areas in Bhutan. Each boundary is selectable and carries a stable identifier, so you can add your own values or distinguish neighbouring areas with a categorical colour scheme.
Open map →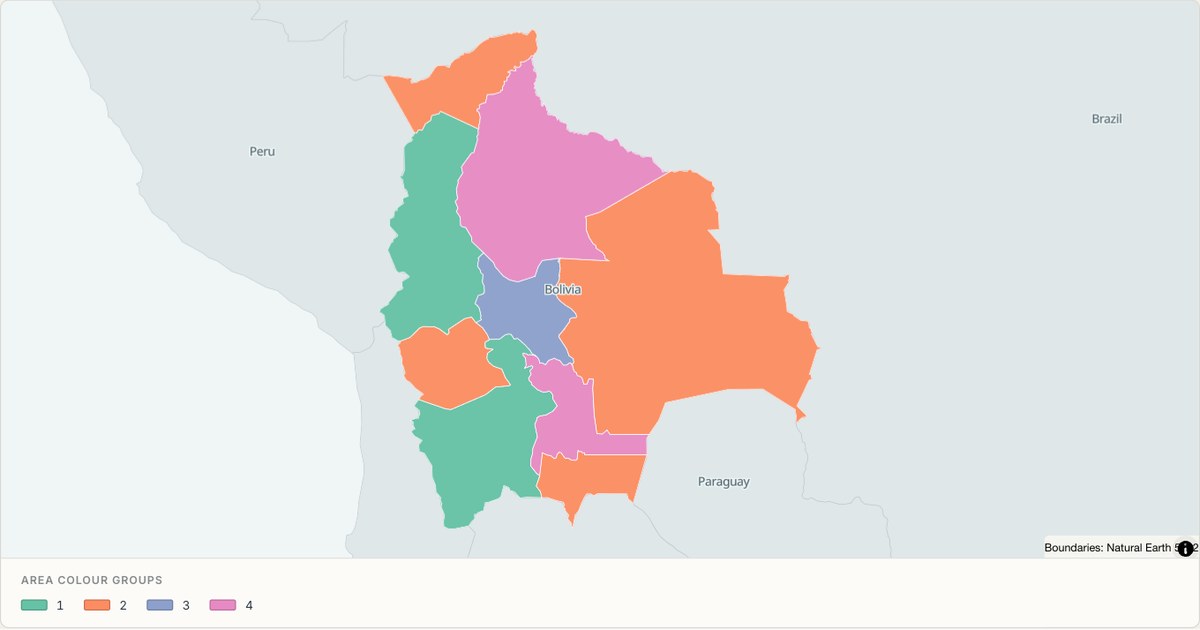 TopoJSONCategorical regions
Bolivia administrative map
Explore 9 named areas in Bolivia. Each boundary is selectable and carries a stable identifier, so you can add your own values or distinguish neighbouring areas with a categorical colour scheme.
Open map →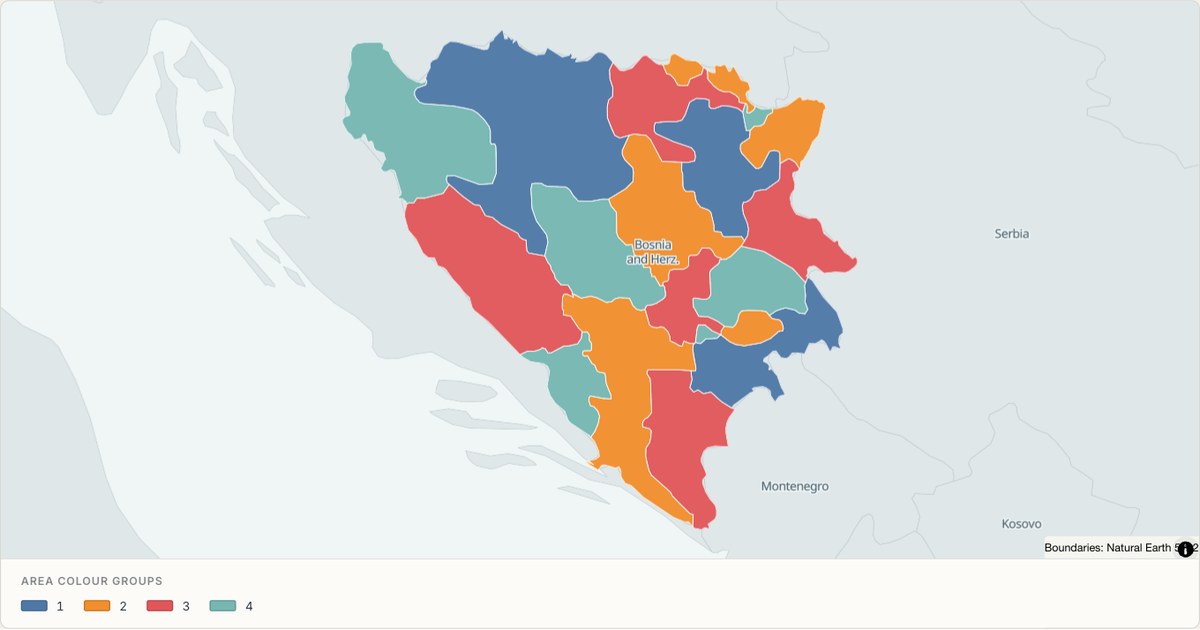 TopoJSONCategorical regions
Bosnia and Herzegovina administrative map
Explore 18 named areas in Bosnia and Herzegovina. Each boundary is selectable and carries a stable identifier, so you can add your own values or distinguish neighbouring areas with a categorical colour scheme.
Open map →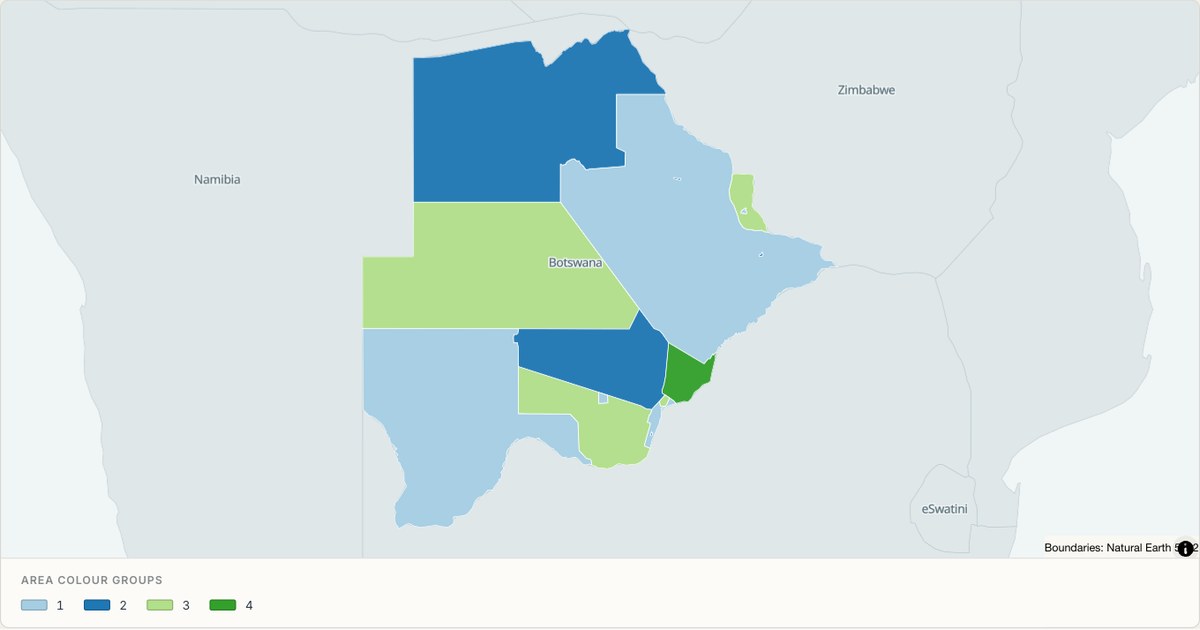 TopoJSONCategorical regions
Botswana administrative map
Explore 15 named areas in Botswana. Each boundary is selectable and carries a stable identifier, so you can add your own values or distinguish neighbouring areas with a categorical colour scheme.
Open map →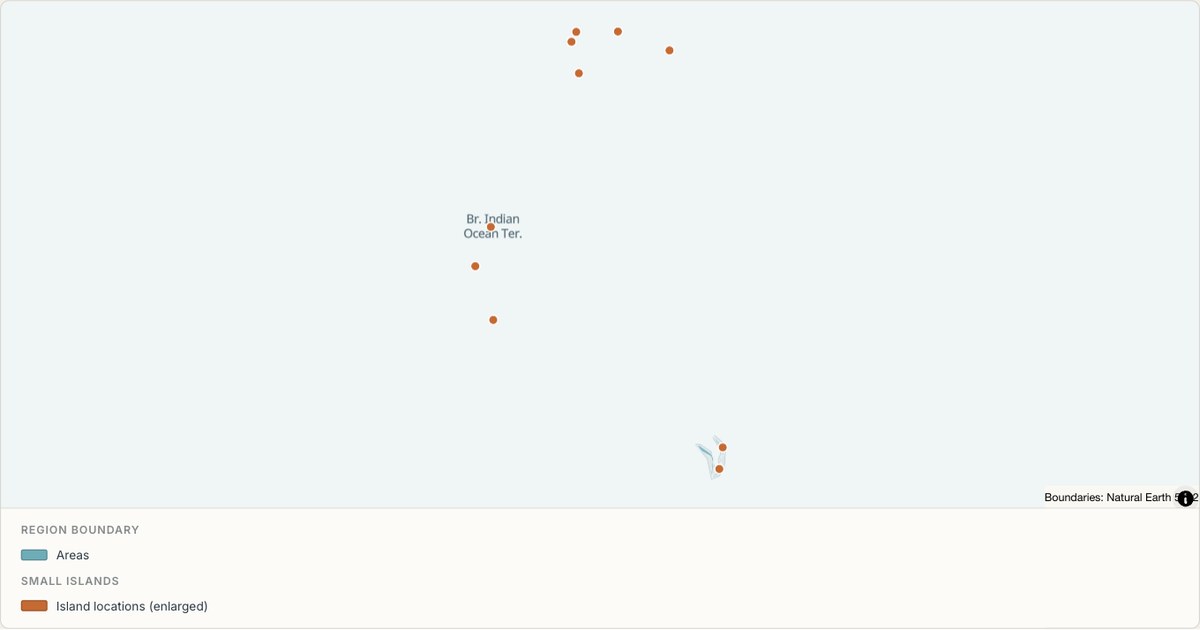 TopoJSONSingle boundary
British Indian Ocean Territory boundary map
Explore the boundary supplied for British Indian Ocean Territory. This snapshot contains one feature and does not provide internal subdivisions. Inspect its identifier and source attributes, or use it as a starting outline for your own map.
Open map →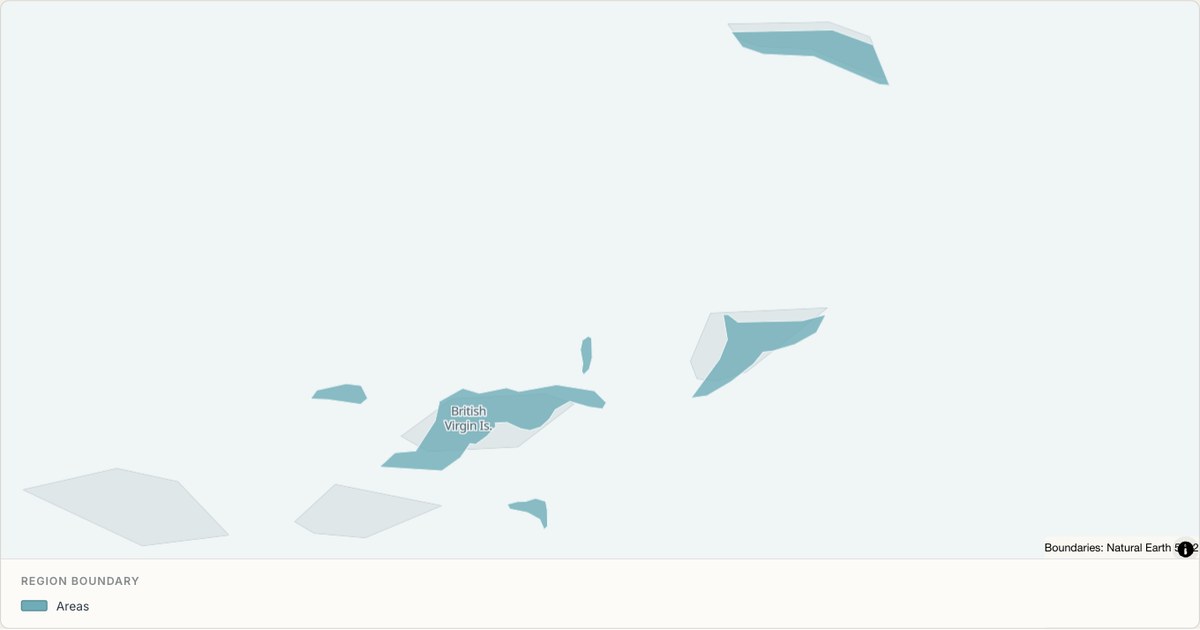 TopoJSONSingle boundary
British Virgin Islands boundary map
Explore the boundary supplied for British Virgin Islands. This snapshot contains one feature and does not provide internal subdivisions. Inspect its identifier and source attributes, or use it as a starting outline for your own map.
Open map →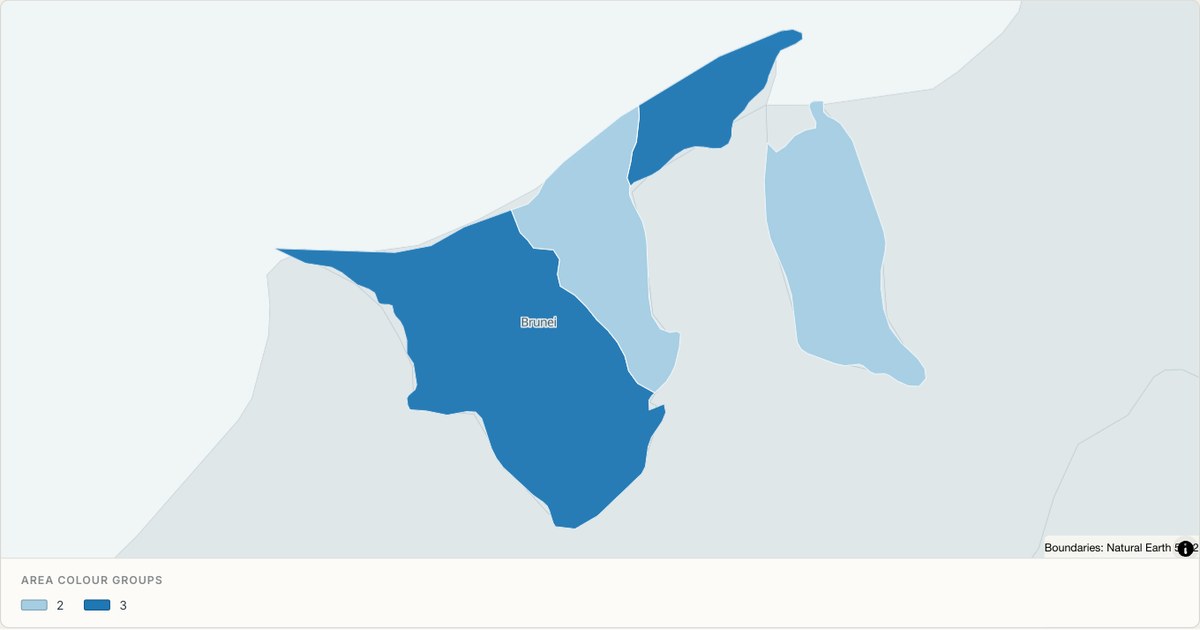 TopoJSONCategorical regions
Brunei administrative map
Explore 4 named areas in Brunei. Each boundary is selectable and carries a stable identifier, so you can add your own values or distinguish neighbouring areas with a categorical colour scheme.
Open map →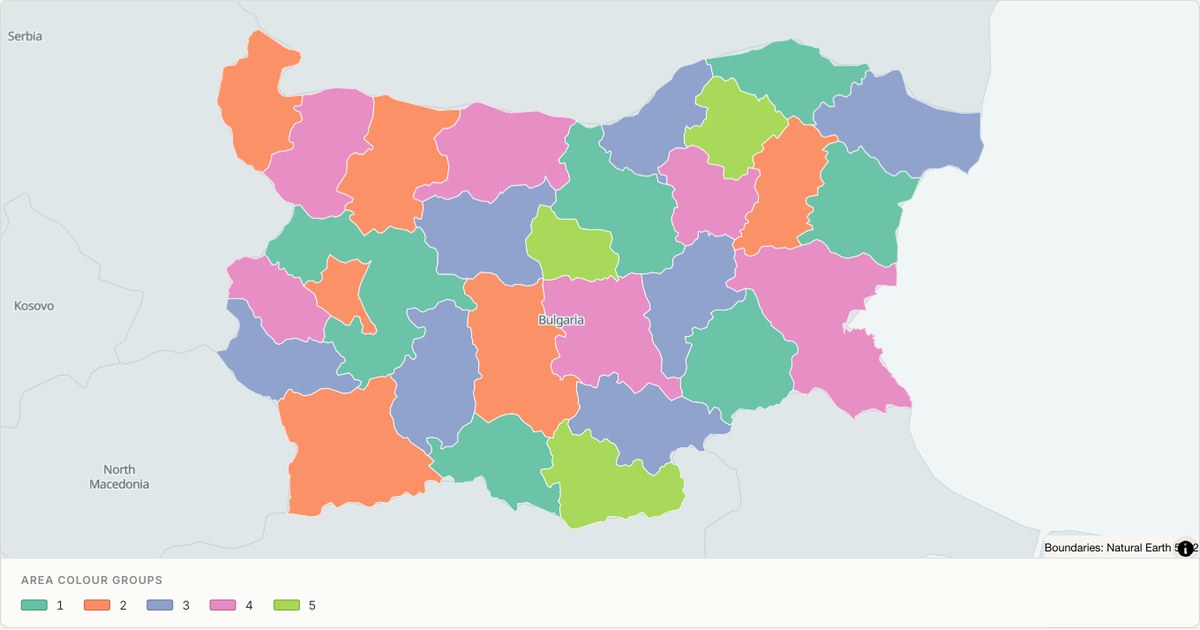 TopoJSONCategorical regions
Bulgaria administrative map
Explore 28 named areas in Bulgaria. Each boundary is selectable and carries a stable identifier, so you can add your own values or distinguish neighbouring areas with a categorical colour scheme.
Open map →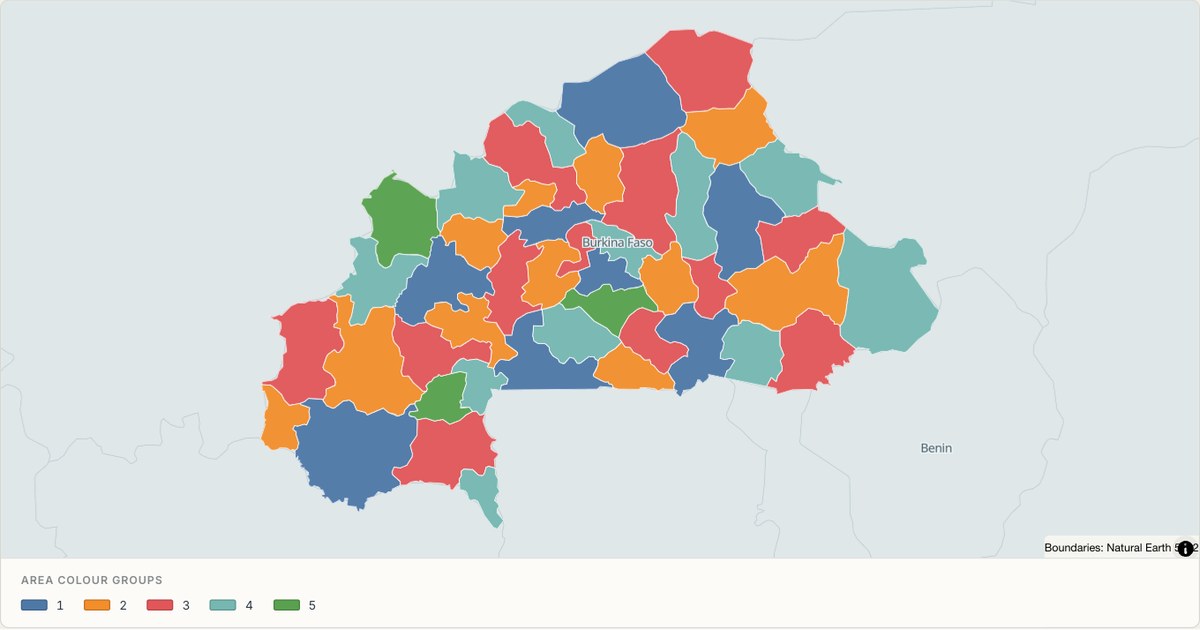 TopoJSONCategorical regions
Burkina Faso administrative map
Explore 45 named areas in Burkina Faso. Each boundary is selectable and carries a stable identifier, so you can add your own values or distinguish neighbouring areas with a categorical colour scheme.
Open map →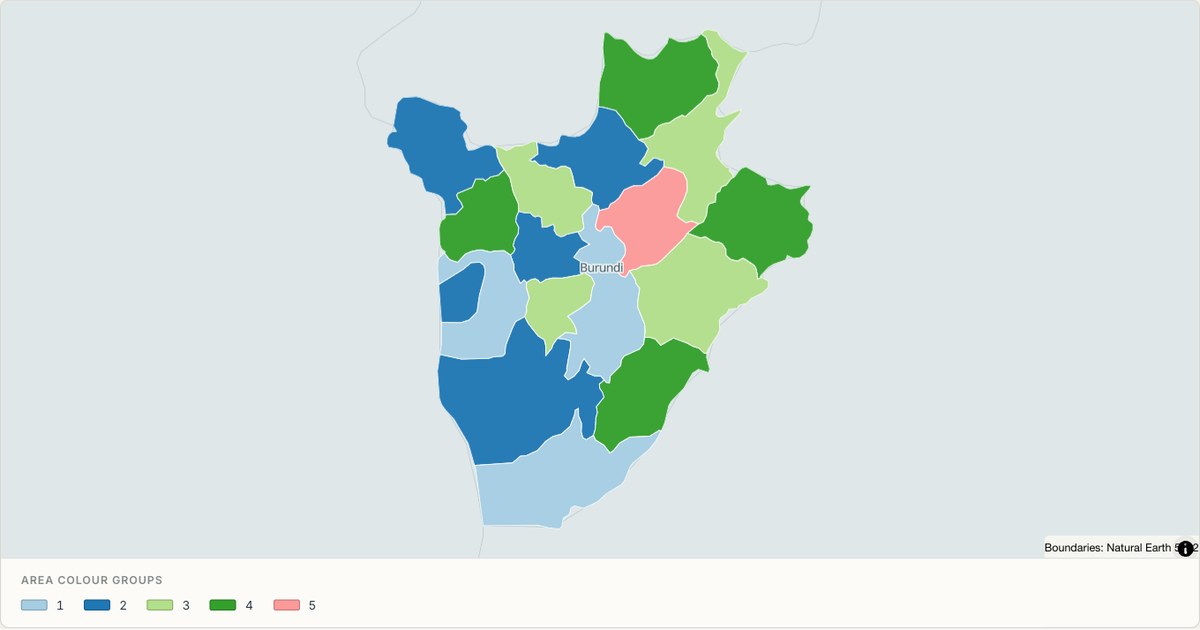 TopoJSONCategorical regions
Burundi administrative map
Explore 17 named areas in Burundi. Each boundary is selectable and carries a stable identifier, so you can add your own values or distinguish neighbouring areas with a categorical colour scheme.
Open map →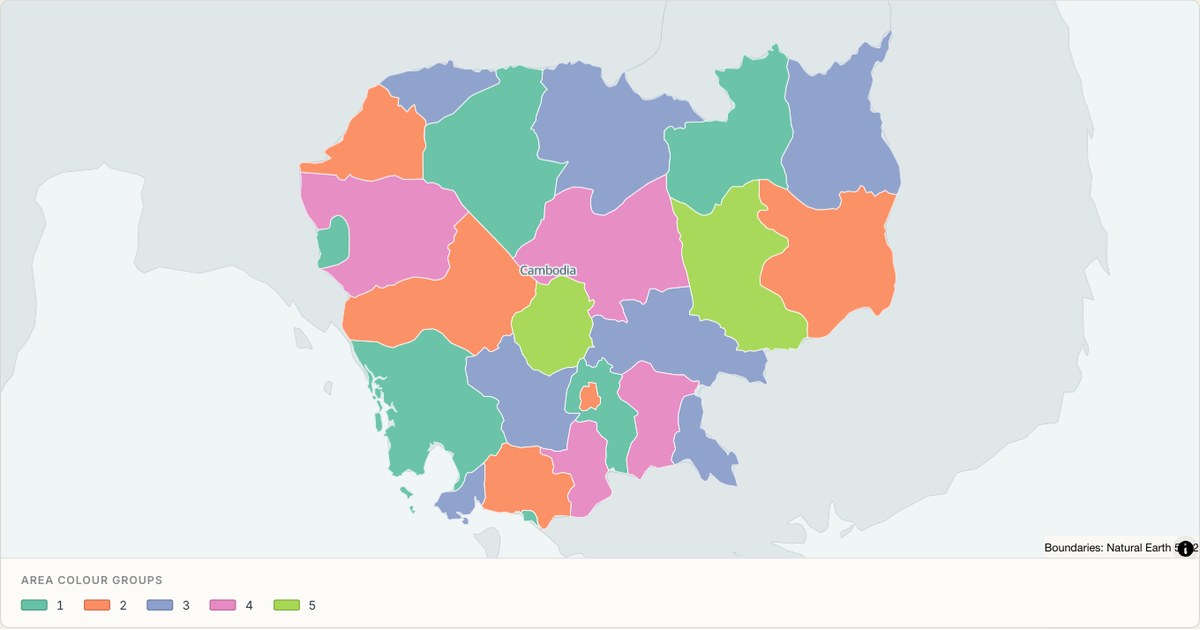 TopoJSONCategorical regions
Cambodia administrative map
Explore 24 named areas in Cambodia. Each boundary is selectable and carries a stable identifier, so you can add your own values or distinguish neighbouring areas with a categorical colour scheme.
Open map →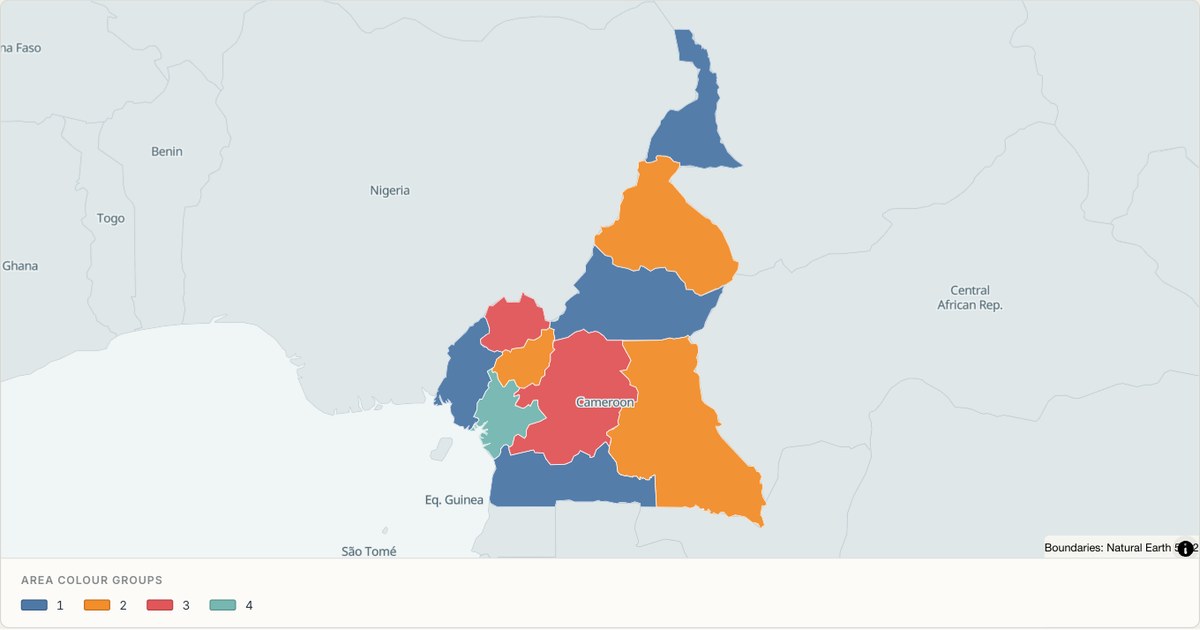 TopoJSONCategorical regions
Cameroon administrative map
Explore 10 named areas in Cameroon. Each boundary is selectable and carries a stable identifier, so you can add your own values or distinguish neighbouring areas with a categorical colour scheme.
Open map →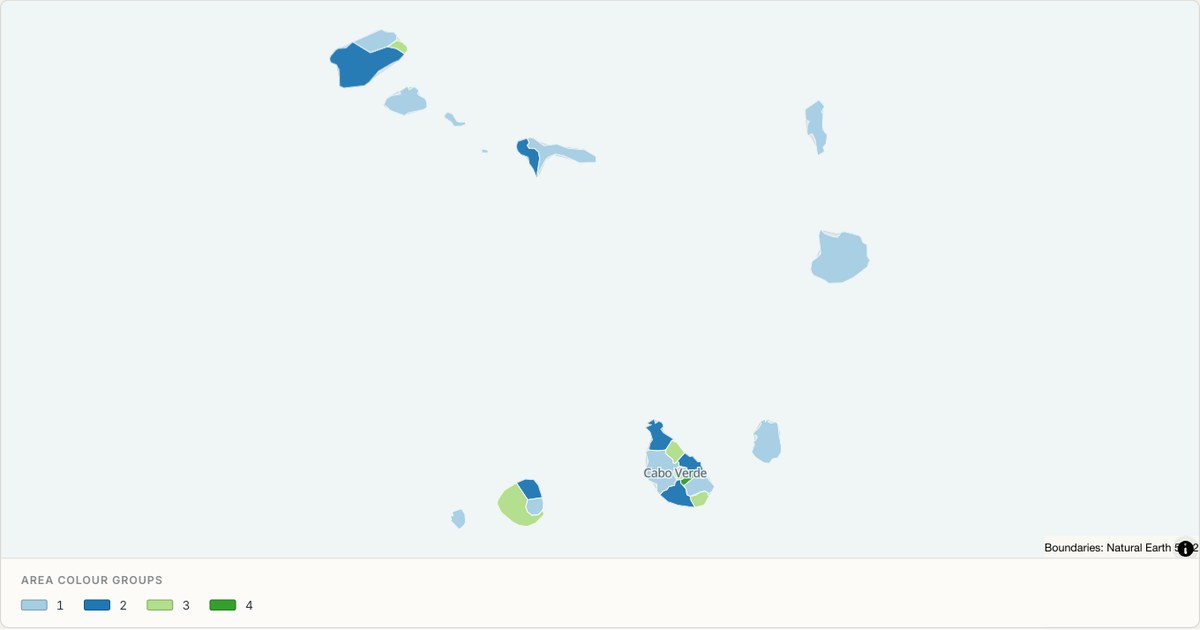 TopoJSONCategorical regions
Cape Verde administrative map
Explore 22 named areas in Cape Verde. Each boundary is selectable and carries a stable identifier, so you can add your own values or distinguish neighbouring areas with a categorical colour scheme.
Open map →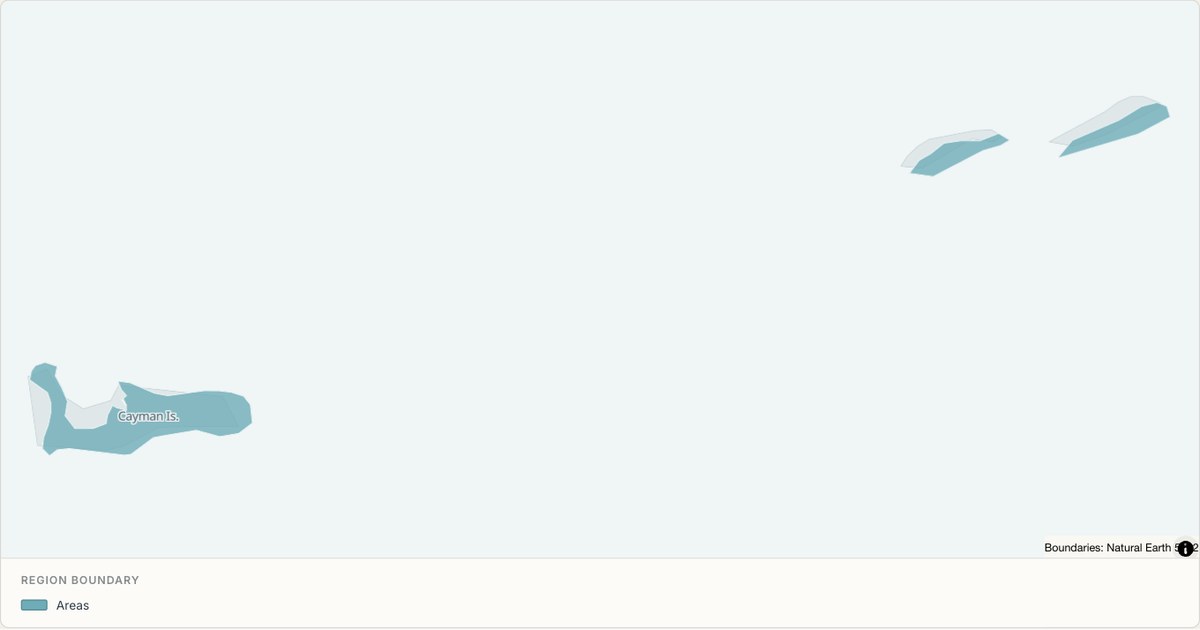 TopoJSONSingle boundary
Cayman Islands boundary map
Explore the boundary supplied for Cayman Islands. This snapshot contains one feature and does not provide internal subdivisions. Inspect its identifier and source attributes, or use it as a starting outline for your own map.
Open map →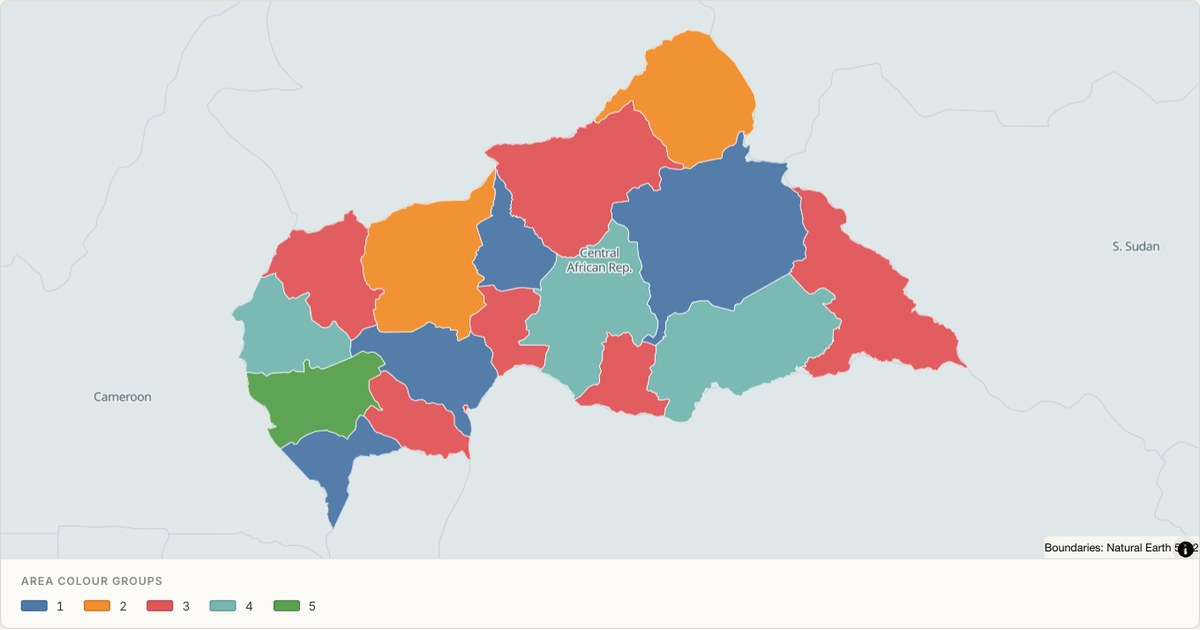 TopoJSONCategorical regions
Central African Republic administrative map
Explore 17 named areas in Central African Republic. Each boundary is selectable and carries a stable identifier, so you can add your own values or distinguish neighbouring areas with a categorical colour scheme.
Open map →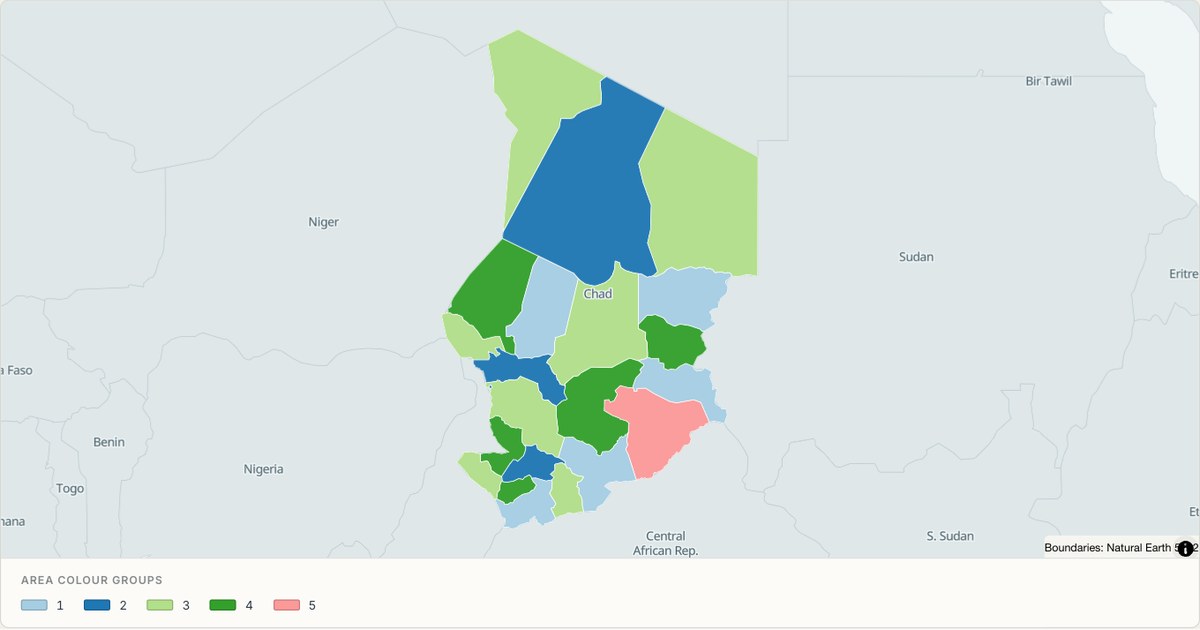 TopoJSONCategorical regions
Chad administrative map
Explore 22 named areas in Chad. Each boundary is selectable and carries a stable identifier, so you can add your own values or distinguish neighbouring areas with a categorical colour scheme.
Open map →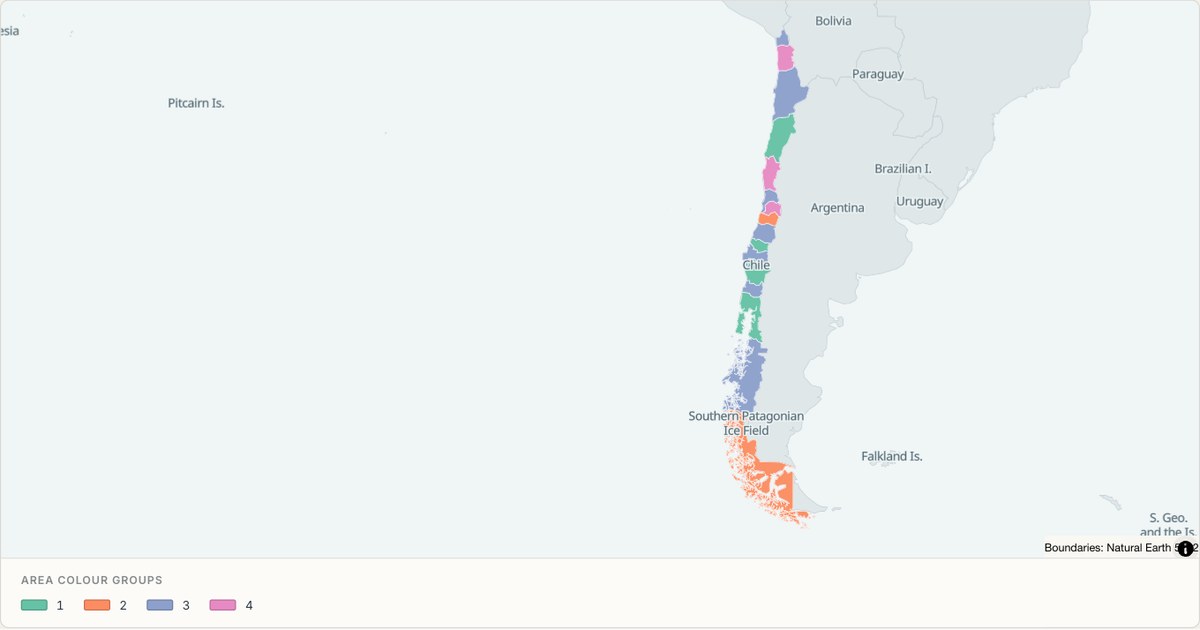 TopoJSONCategorical regions
Chile administrative map
Explore 16 named areas in Chile. Each boundary is selectable and carries a stable identifier, so you can add your own values or distinguish neighbouring areas with a categorical colour scheme.
Open map →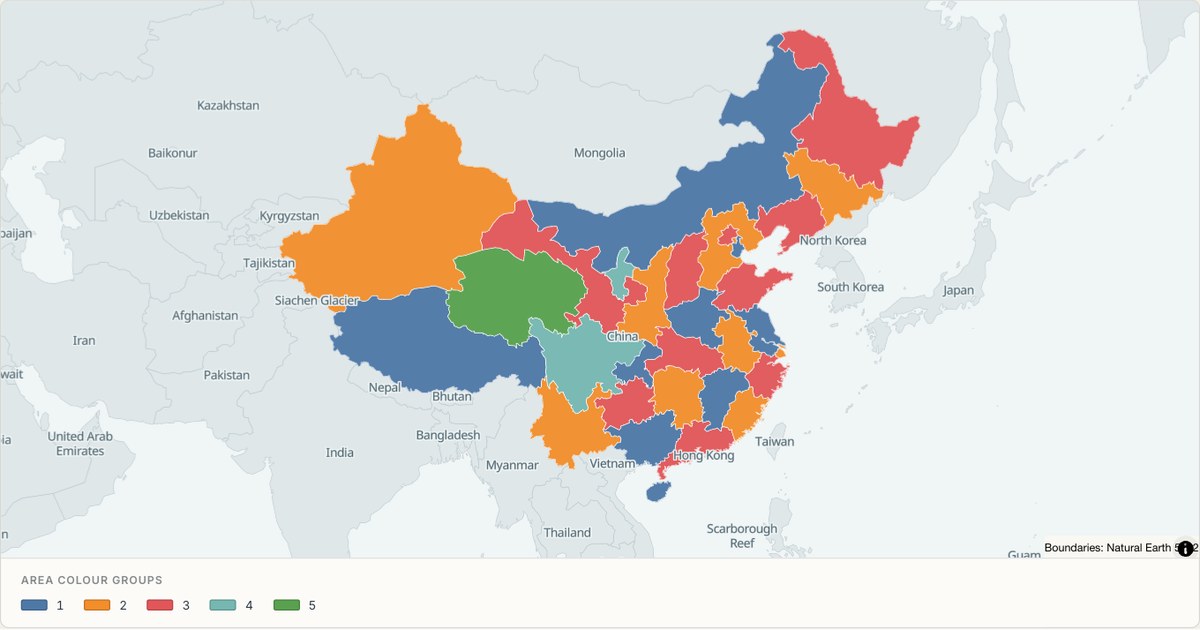 TopoJSONCategorical regions
China administrative map
Explore 32 named areas in China. Each boundary is selectable and carries a stable identifier, so you can add your own values or distinguish neighbouring areas with a categorical colour scheme.
Open map → TopoJSONSingle boundary
Clipperton Island boundary map
Explore the boundary supplied for Clipperton Island. This snapshot contains one feature and does not provide internal subdivisions. Inspect its identifier and source attributes, or use it as a starting outline for your own map.
Open map →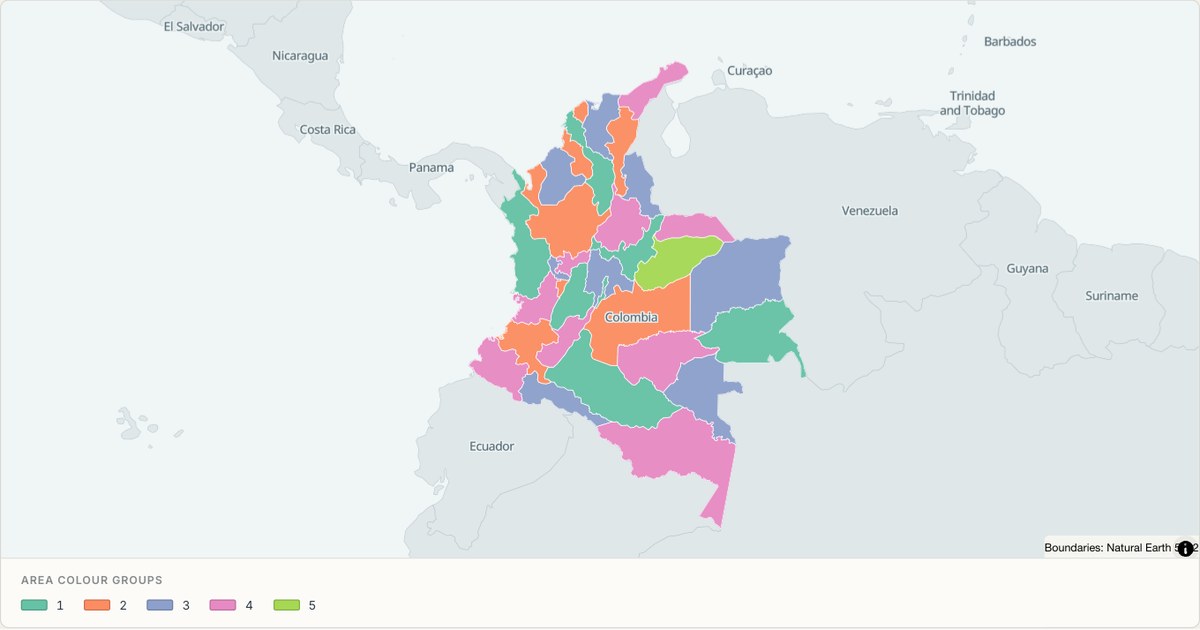 TopoJSONCategorical regions
Colombia administrative map
Explore 34 named areas in Colombia. Each boundary is selectable and carries a stable identifier, so you can add your own values or distinguish neighbouring areas with a categorical colour scheme.
Open map →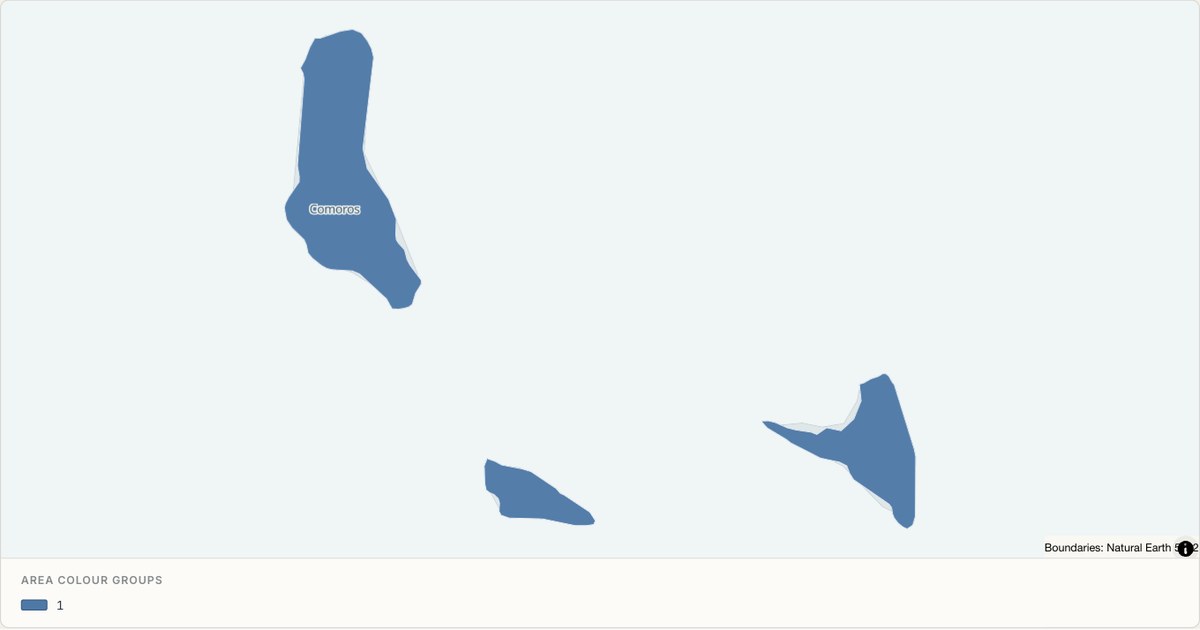 TopoJSONCategorical regions
Comoros administrative map
Explore 3 named areas in Comoros. Each boundary is selectable and carries a stable identifier, so you can add your own values or distinguish neighbouring areas with a categorical colour scheme.
Open map →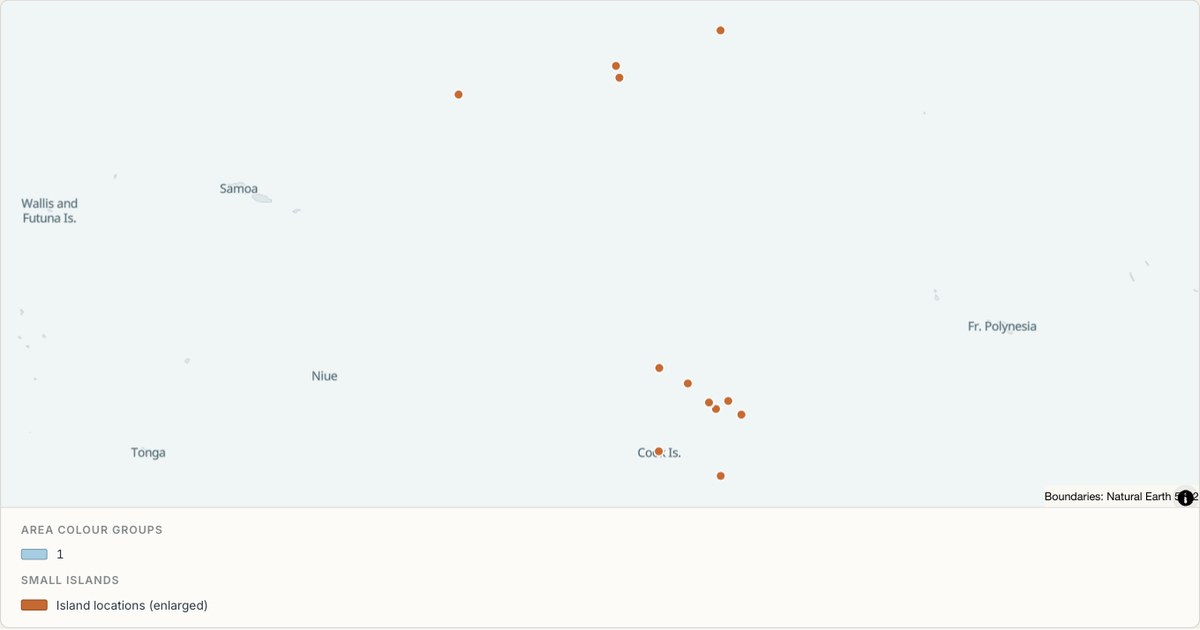 TopoJSONCategorical regions
Cook Islands administrative map
Explore 11 named areas in Cook Islands. Each boundary is selectable and carries a stable identifier, so you can add your own values or distinguish neighbouring areas with a categorical colour scheme.
Open map →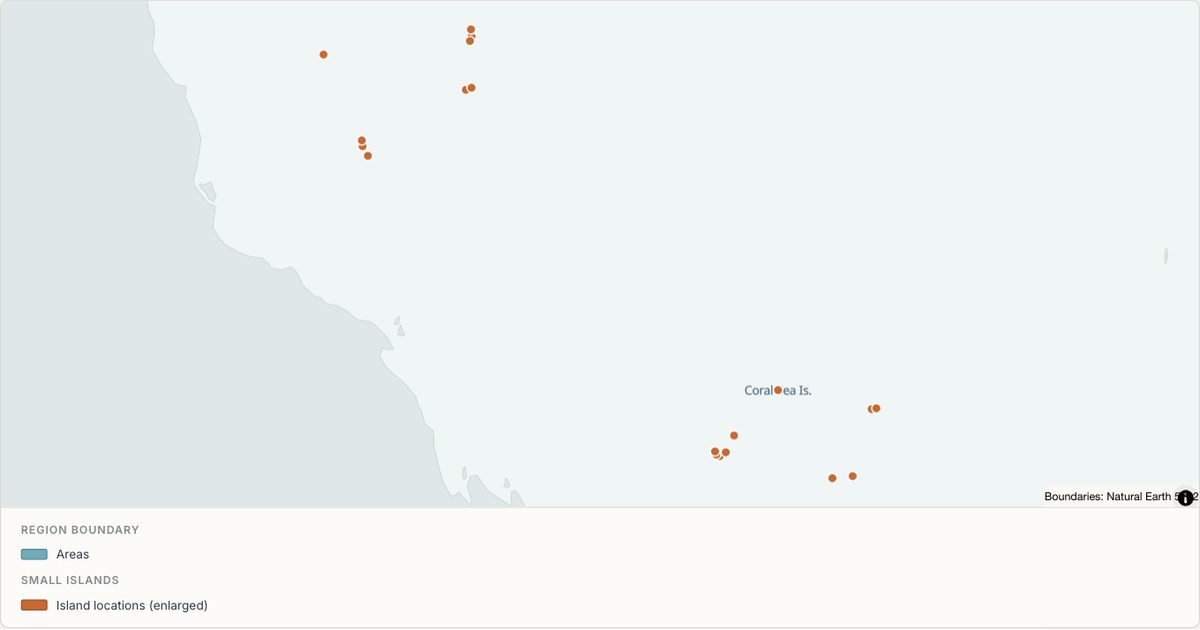 TopoJSONSingle boundary
Coral Sea Islands boundary map
Explore the boundary supplied for Coral Sea Islands. This snapshot contains one feature and does not provide internal subdivisions. Inspect its identifier and source attributes, or use it as a starting outline for your own map.
Open map →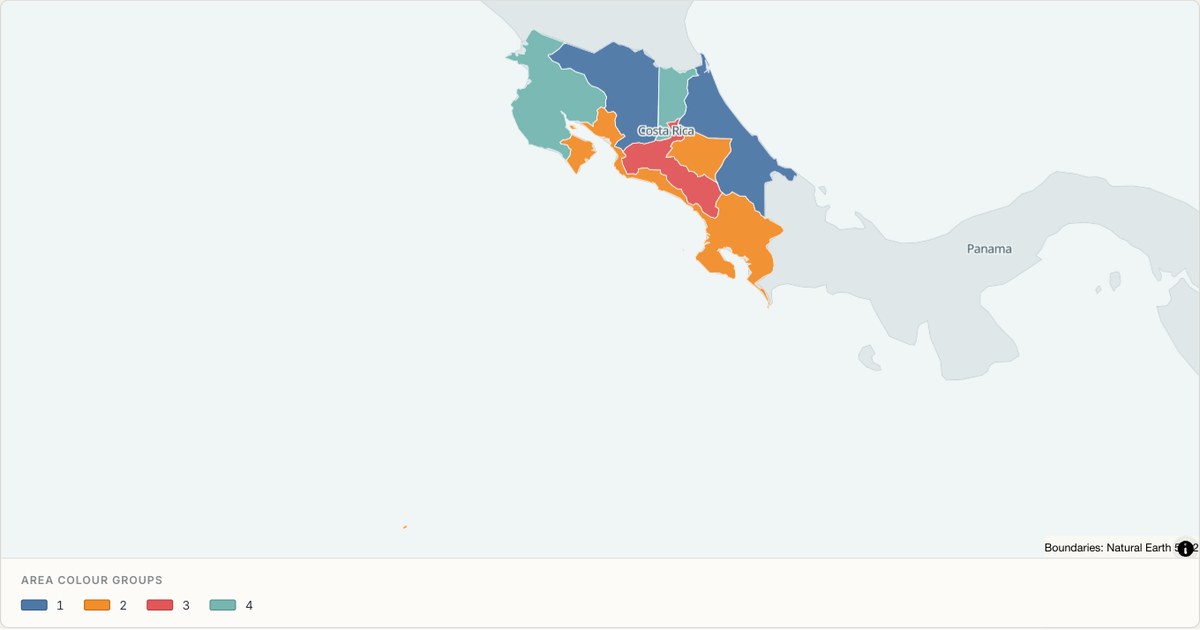 TopoJSONCategorical regions
Costa Rica administrative map
Explore 7 named areas in Costa Rica. Each boundary is selectable and carries a stable identifier, so you can add your own values or distinguish neighbouring areas with a categorical colour scheme.
Open map →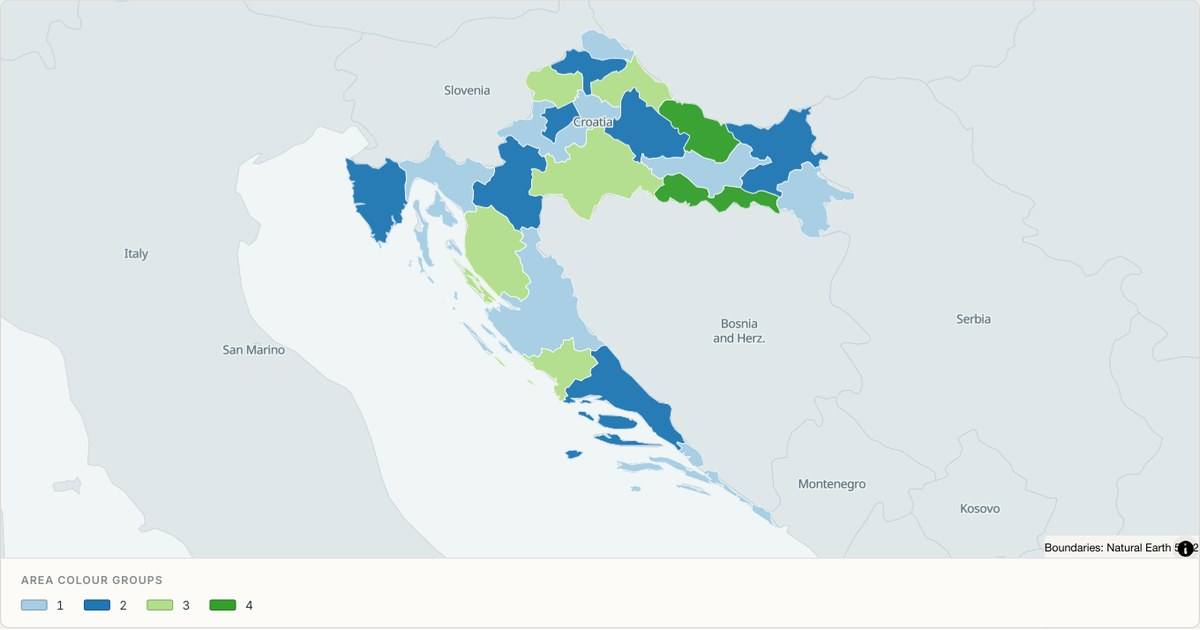 TopoJSONCategorical regions
Croatia administrative map
Explore 21 named areas in Croatia. Each boundary is selectable and carries a stable identifier, so you can add your own values or distinguish neighbouring areas with a categorical colour scheme.
Open map →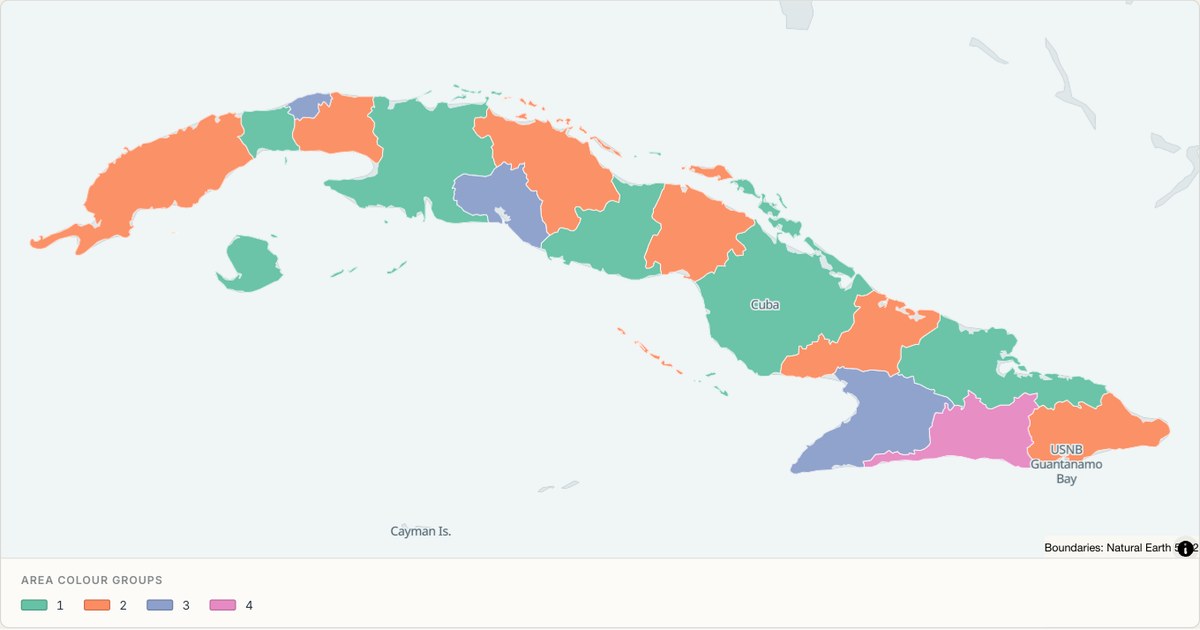 TopoJSONCategorical regions
Cuba administrative map
Explore 16 named areas in Cuba. Each boundary is selectable and carries a stable identifier, so you can add your own values or distinguish neighbouring areas with a categorical colour scheme.
Open map →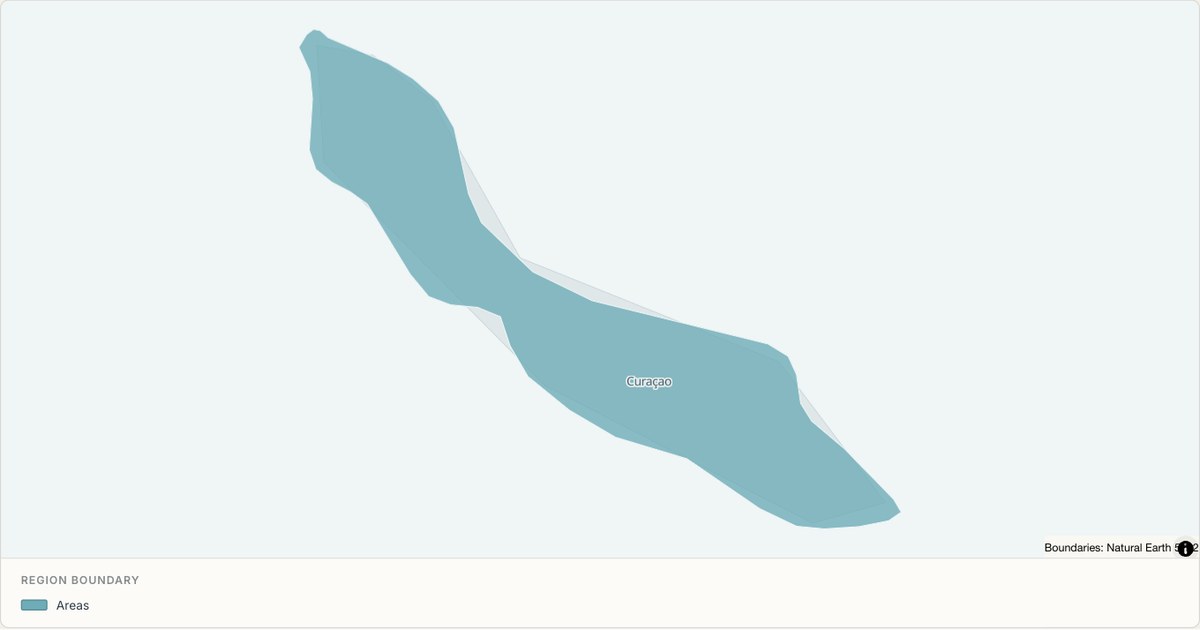 TopoJSONSingle boundary
Curaçao boundary map
Explore the boundary supplied for Curaçao. This snapshot contains one feature and does not provide internal subdivisions. Inspect its identifier and source attributes, or use it as a starting outline for your own map.
Open map →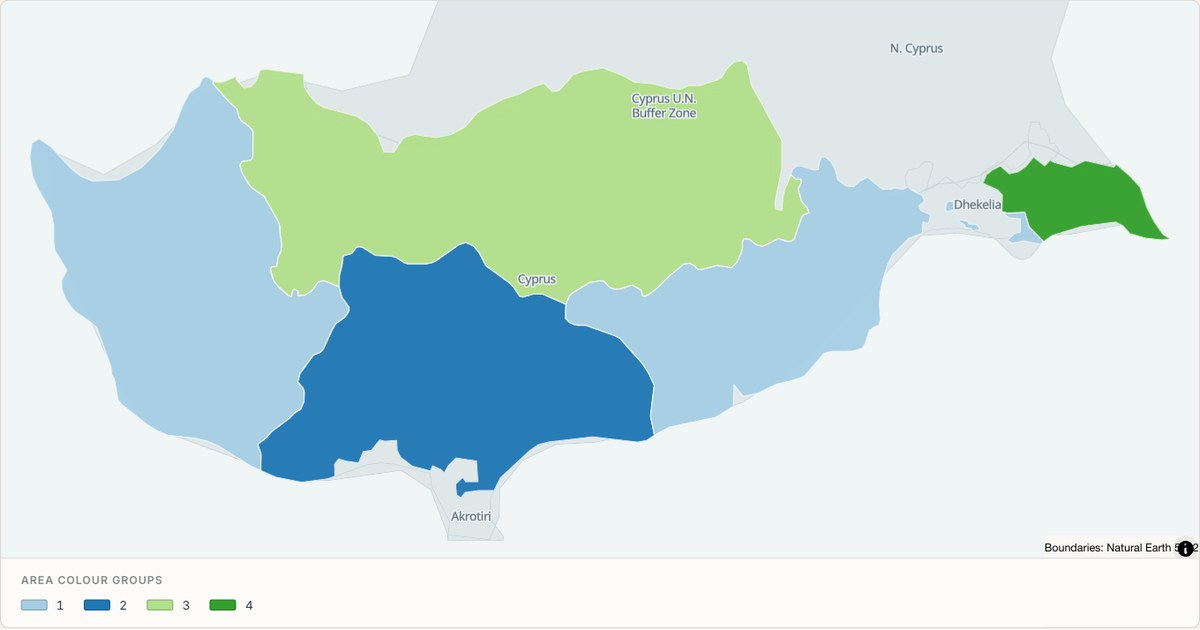 TopoJSONCategorical regions
Cyprus administrative map
Explore 5 named areas in Cyprus. Each boundary is selectable and carries a stable identifier, so you can add your own values or distinguish neighbouring areas with a categorical colour scheme.
Open map →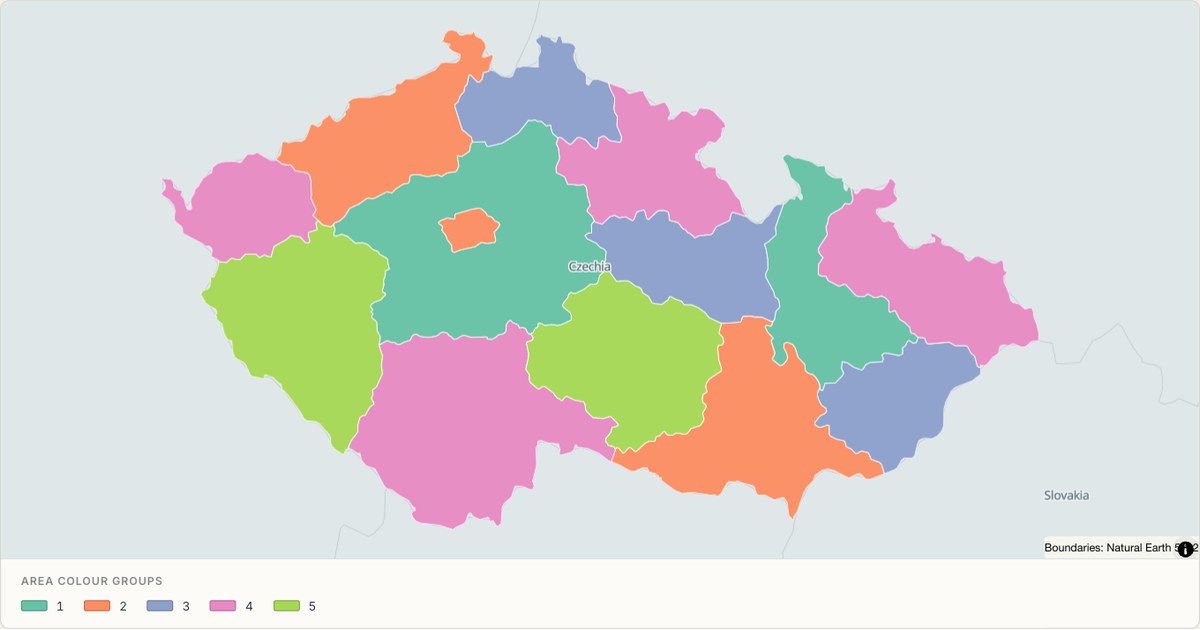 TopoJSONCategorical regions
Czech Republic administrative map
Explore 14 named areas in Czech Republic. Each boundary is selectable and carries a stable identifier, so you can add your own values or distinguish neighbouring areas with a categorical colour scheme.
Open map →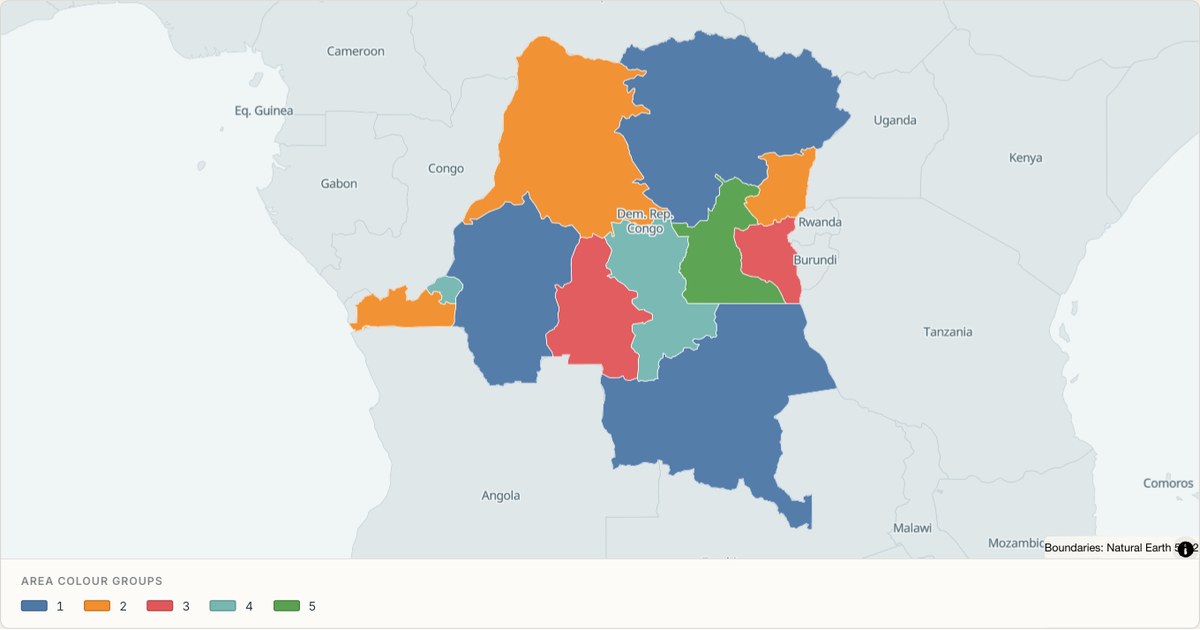 TopoJSONCategorical regions
Democratic Republic of the Congo administrative map
Explore 11 named areas in Democratic Republic of the Congo. Each boundary is selectable and carries a stable identifier, so you can add your own values or distinguish neighbouring areas with a categorical colour scheme.
Open map →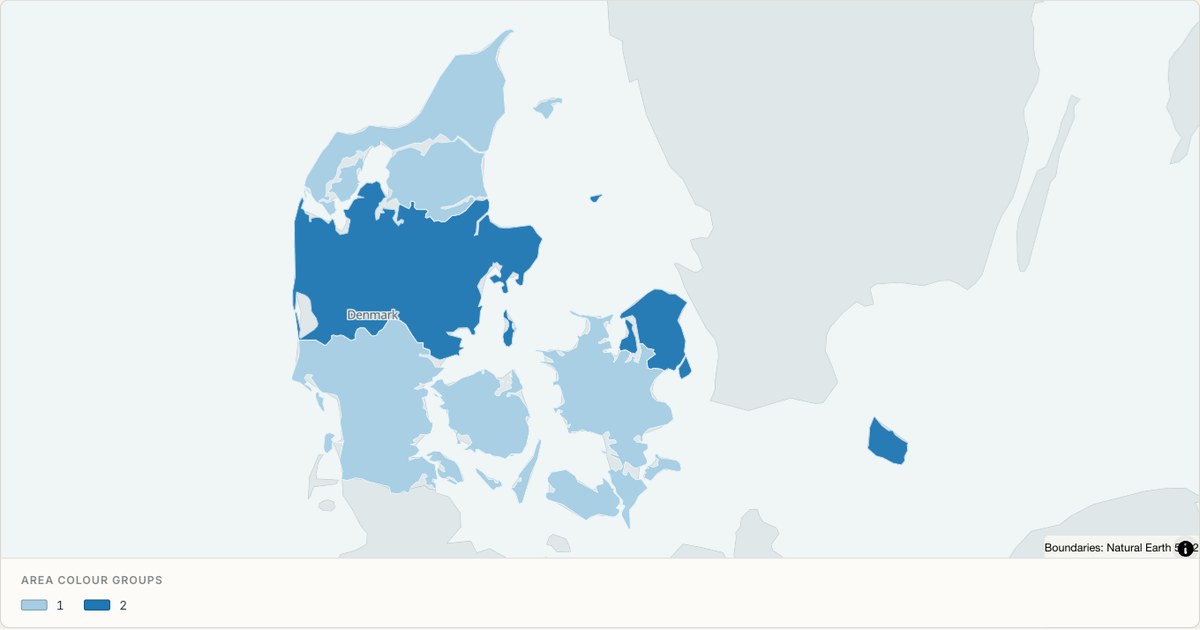 TopoJSONCategorical regions
Denmark administrative map
Explore 5 named areas in Denmark. Each boundary is selectable and carries a stable identifier, so you can add your own values or distinguish neighbouring areas with a categorical colour scheme.
Open map →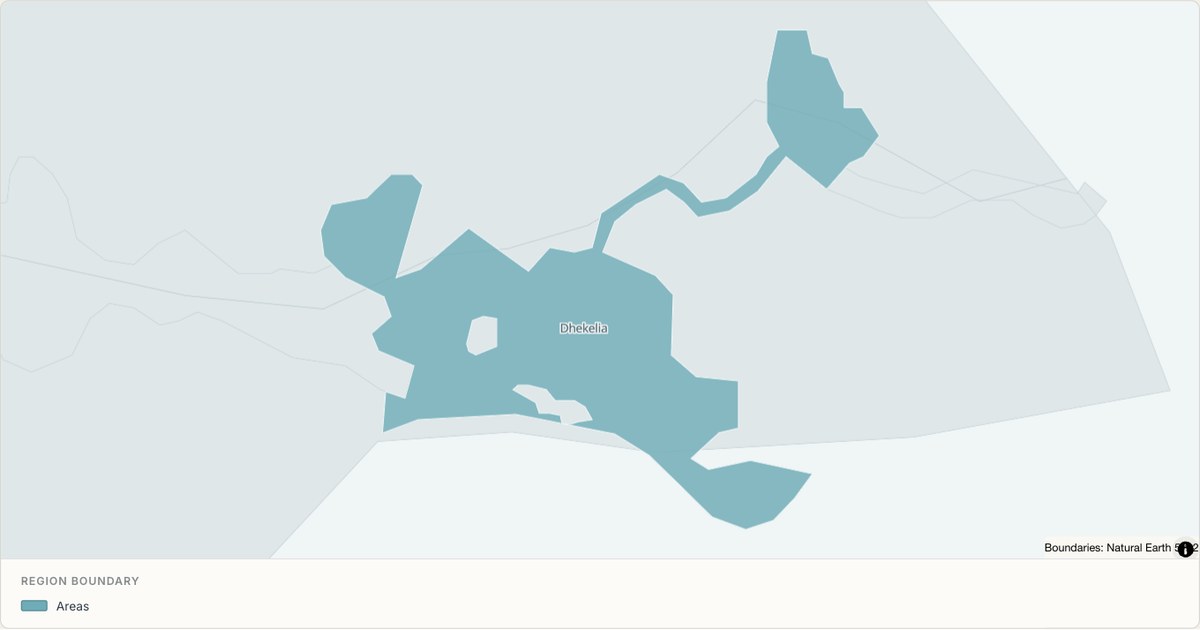 TopoJSONSingle boundary
Dhekelia Sovereign Base Area boundary map
Explore the boundary supplied for Dhekelia Sovereign Base Area. This snapshot contains one feature and does not provide internal subdivisions. Inspect its identifier and source attributes, or use it as a starting outline for your own map.
Open map →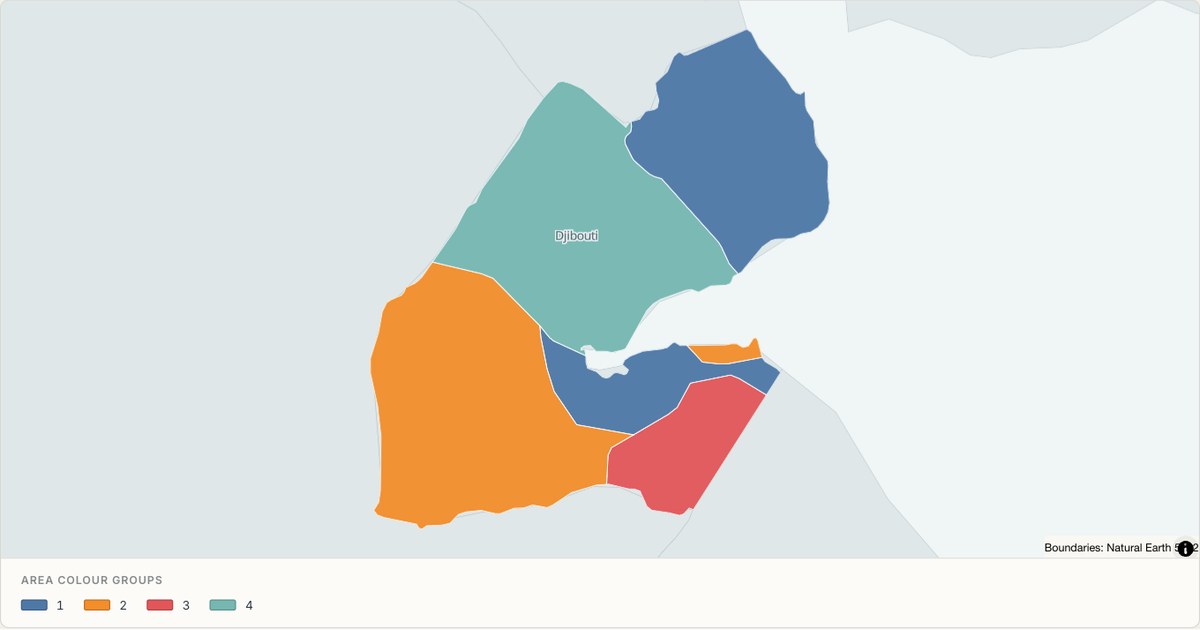 TopoJSONCategorical regions
Djibouti administrative map
Explore 6 named areas in Djibouti. Each boundary is selectable and carries a stable identifier, so you can add your own values or distinguish neighbouring areas with a categorical colour scheme.
Open map →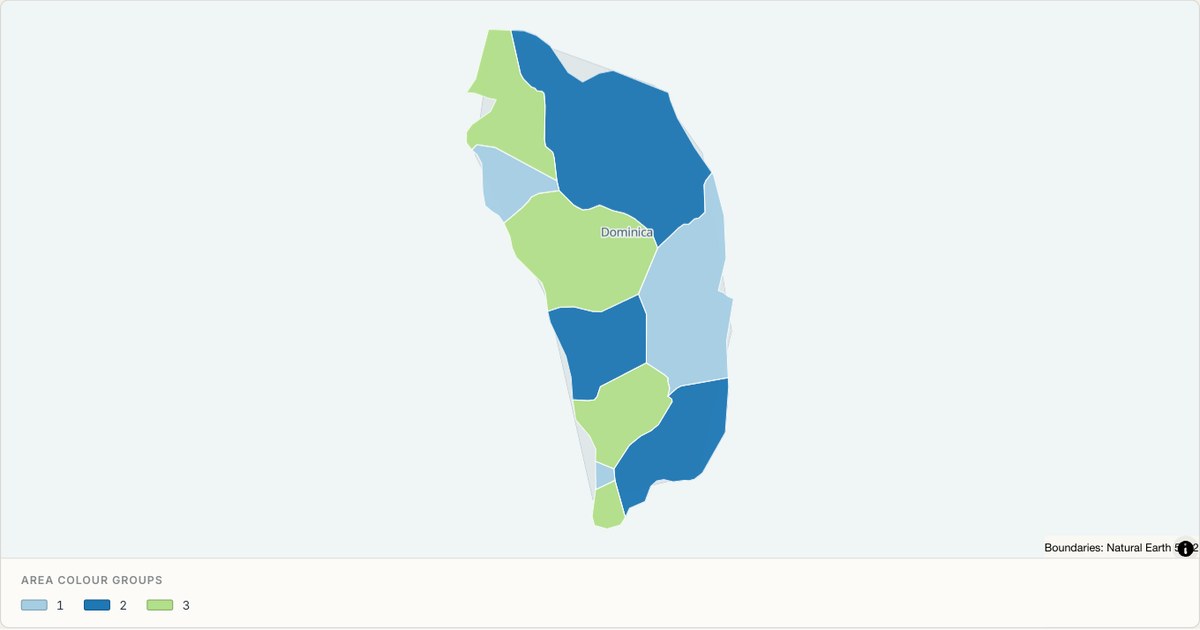 TopoJSONCategorical regions
Dominica administrative map
Explore 10 named areas in Dominica. Each boundary is selectable and carries a stable identifier, so you can add your own values or distinguish neighbouring areas with a categorical colour scheme.
Open map →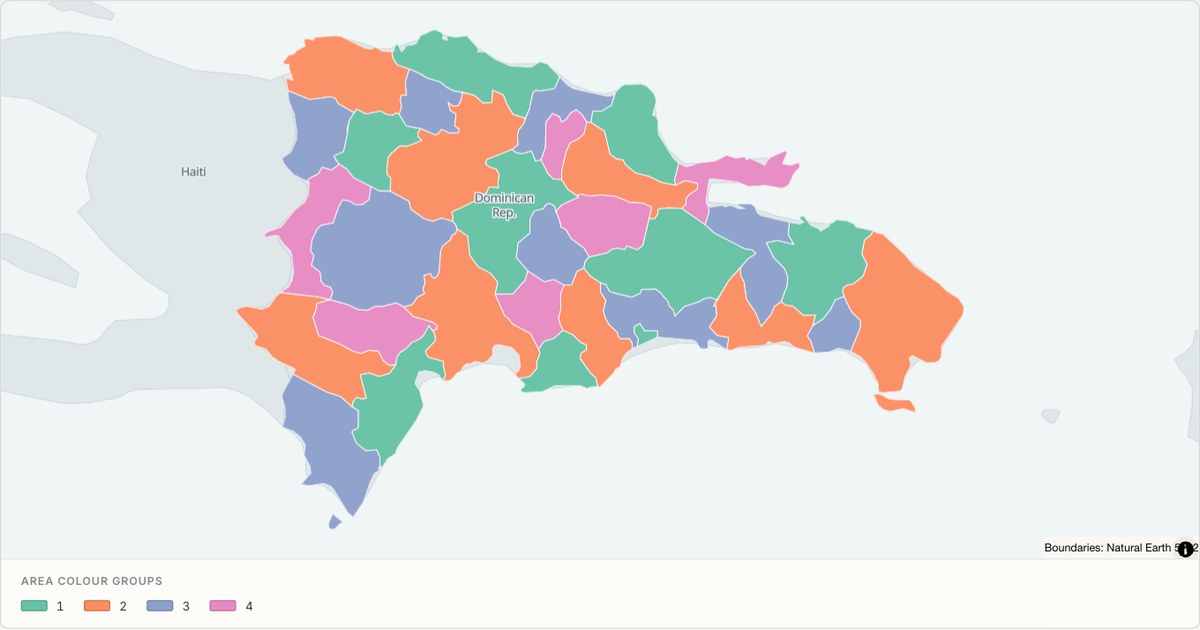 TopoJSONCategorical regions
Dominican Republic administrative map
Explore 32 named areas in Dominican Republic. Each boundary is selectable and carries a stable identifier, so you can add your own values or distinguish neighbouring areas with a categorical colour scheme.
Open map →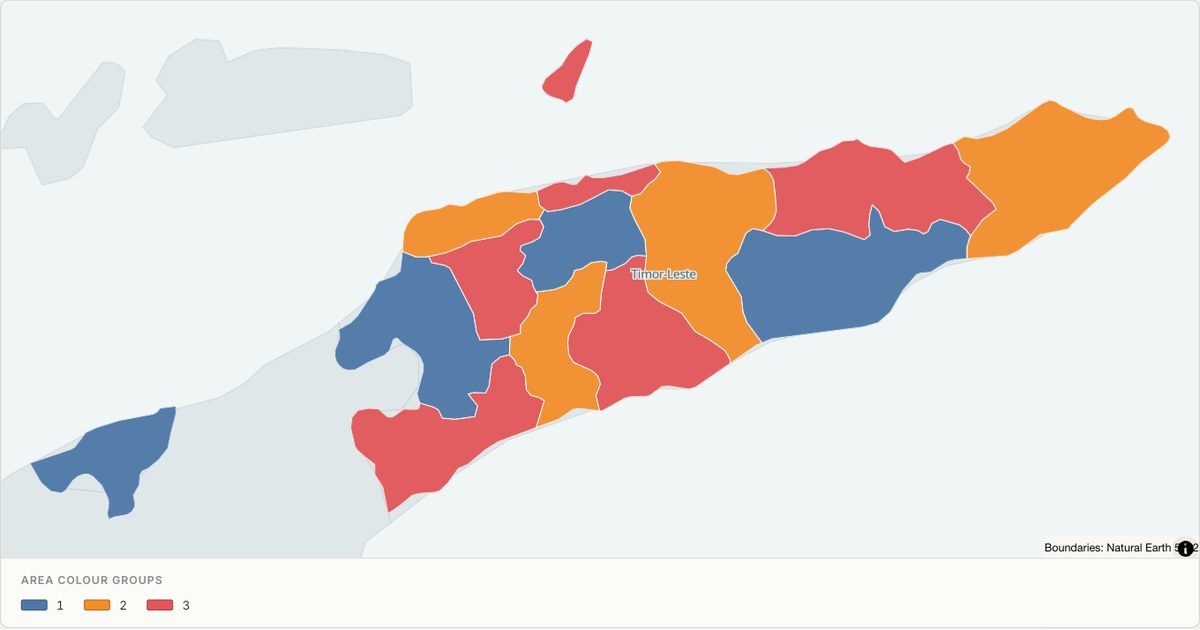 TopoJSONCategorical regions
East Timor administrative map
Explore 13 named areas in East Timor. Each boundary is selectable and carries a stable identifier, so you can add your own values or distinguish neighbouring areas with a categorical colour scheme.
Open map →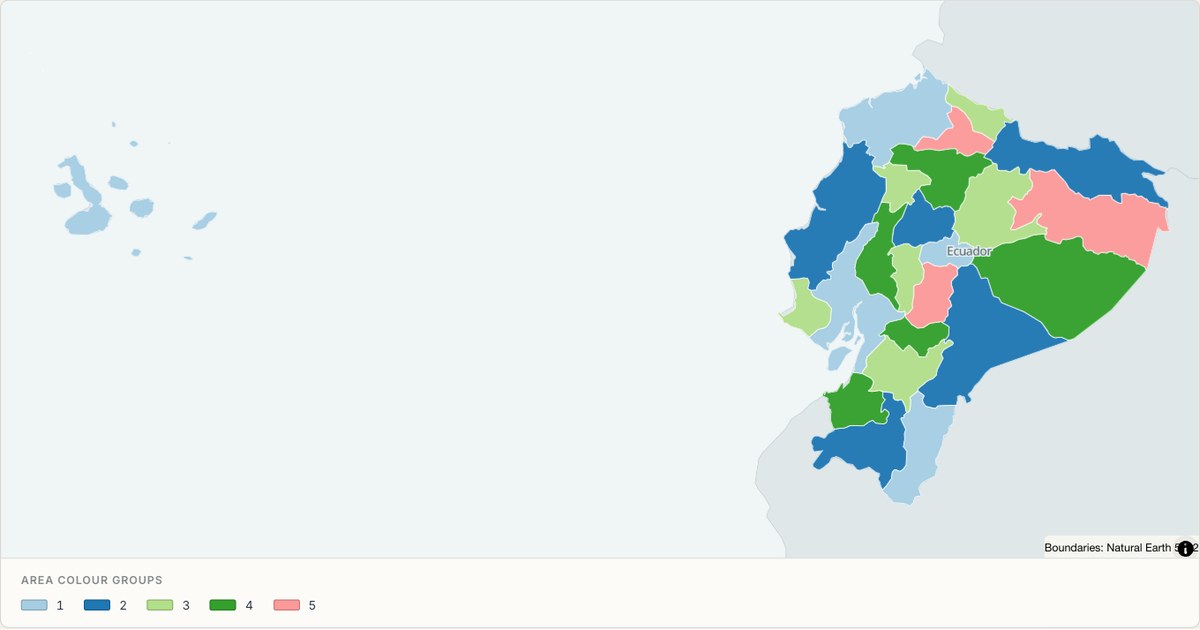 TopoJSONCategorical regions
Ecuador administrative map
Explore 24 named areas in Ecuador. Each boundary is selectable and carries a stable identifier, so you can add your own values or distinguish neighbouring areas with a categorical colour scheme.
Open map →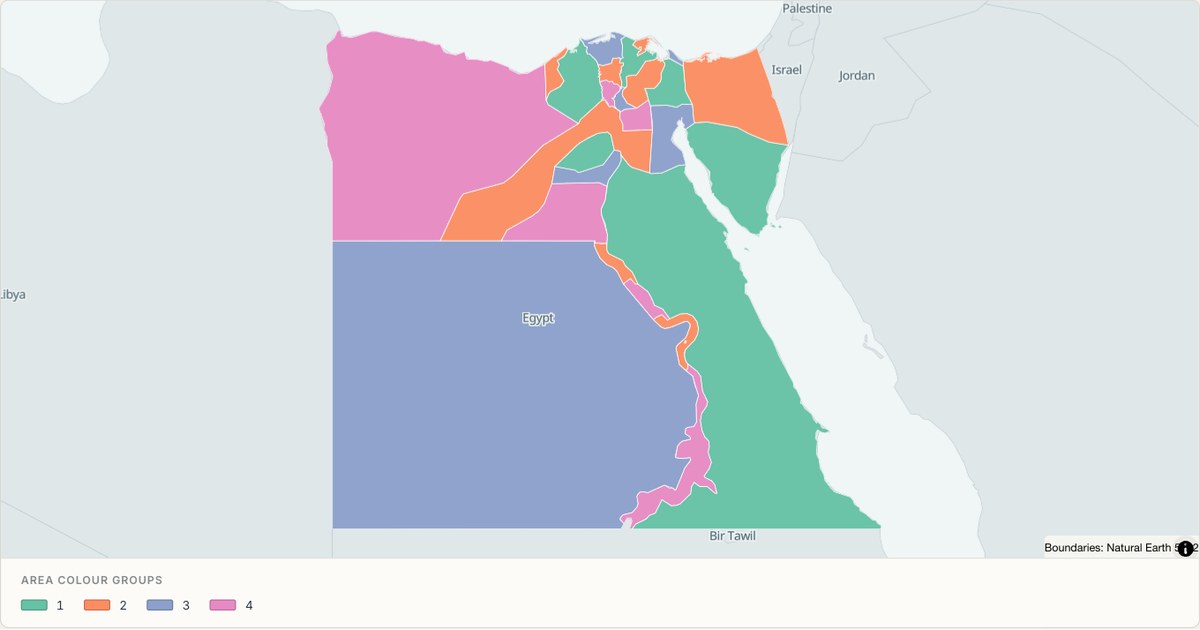 TopoJSONCategorical regions
Egypt administrative map
Explore 27 named areas in Egypt. Each boundary is selectable and carries a stable identifier, so you can add your own values or distinguish neighbouring areas with a categorical colour scheme.
Open map →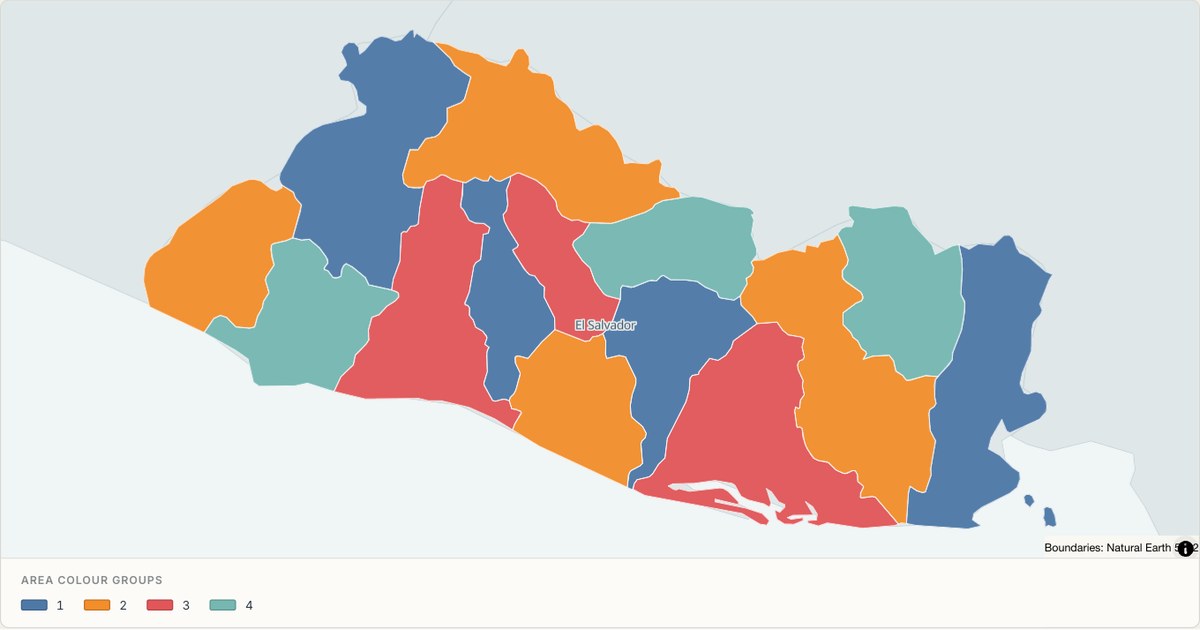 TopoJSONCategorical regions
El Salvador administrative map
Explore 14 named areas in El Salvador. Each boundary is selectable and carries a stable identifier, so you can add your own values or distinguish neighbouring areas with a categorical colour scheme.
Open map →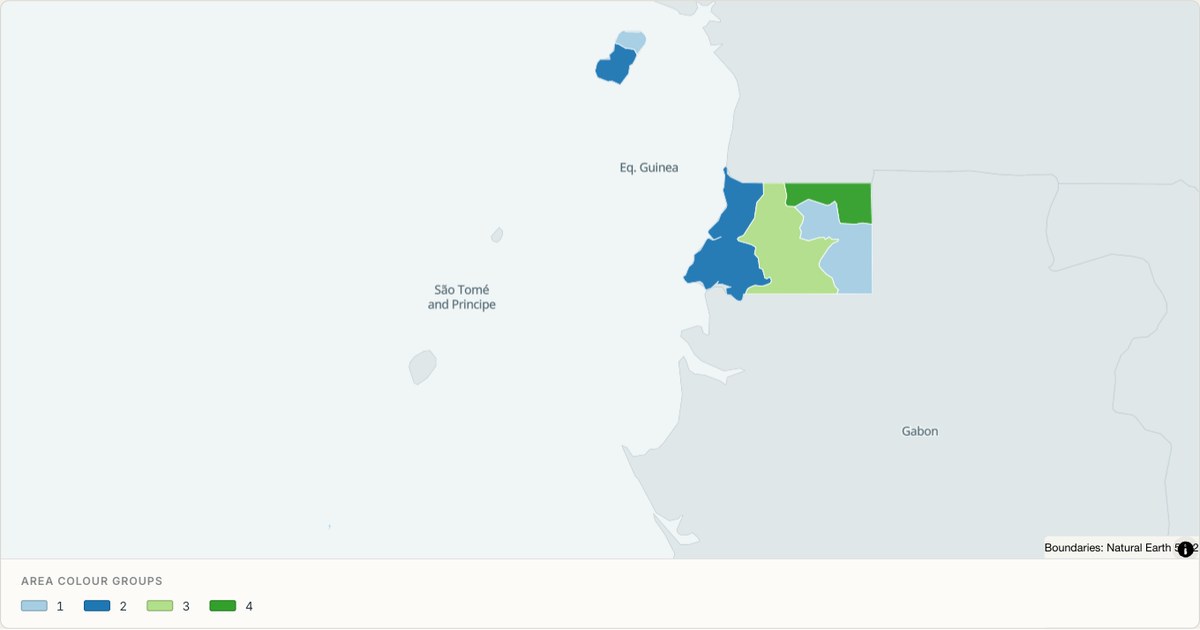 TopoJSONCategorical regions
Equatorial Guinea administrative map
Explore 7 named areas in Equatorial Guinea. Each boundary is selectable and carries a stable identifier, so you can add your own values or distinguish neighbouring areas with a categorical colour scheme.
Open map →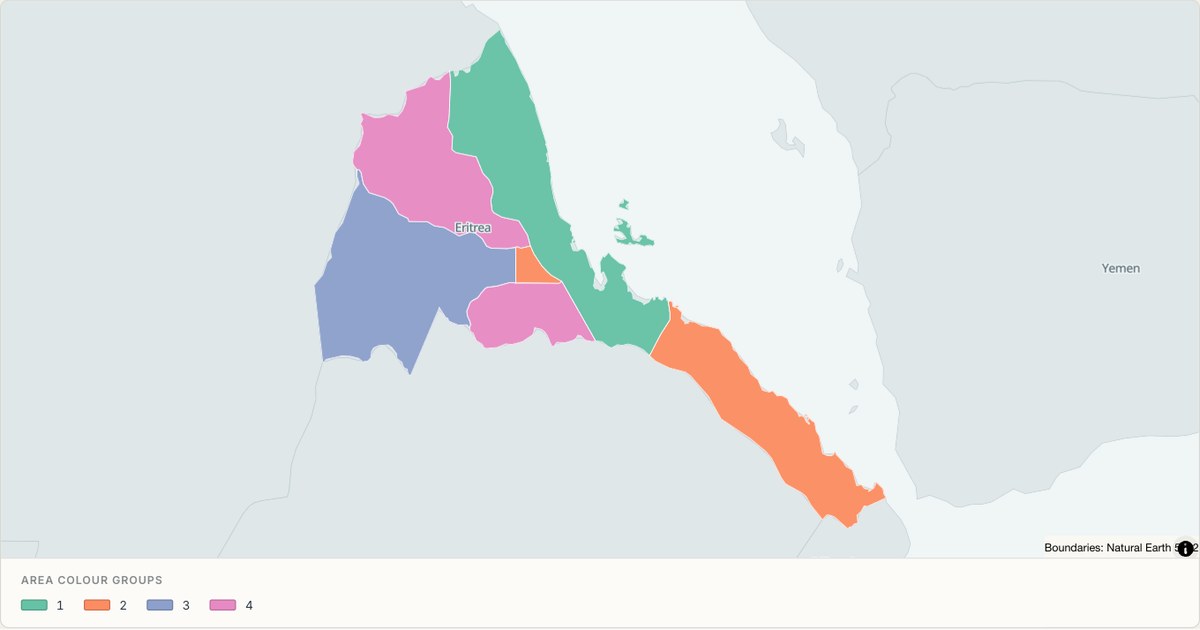 TopoJSONCategorical regions
Eritrea administrative map
Explore 6 named areas in Eritrea. Each boundary is selectable and carries a stable identifier, so you can add your own values or distinguish neighbouring areas with a categorical colour scheme.
Open map →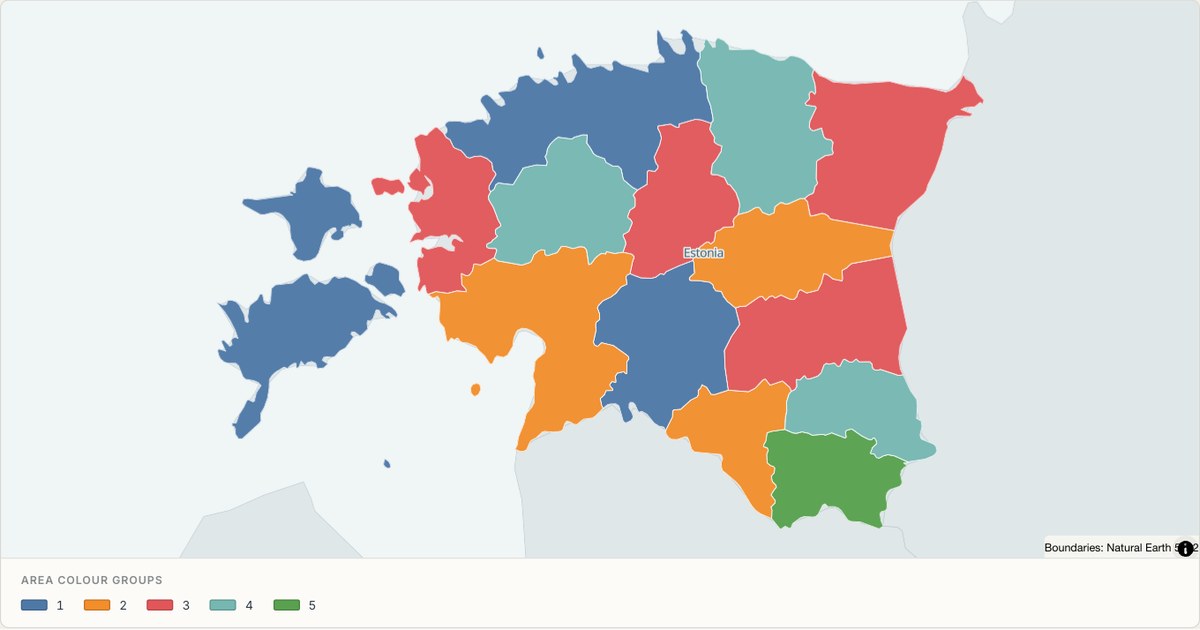 TopoJSONCategorical regions
Estonia administrative map
Explore 15 named areas in Estonia. Each boundary is selectable and carries a stable identifier, so you can add your own values or distinguish neighbouring areas with a categorical colour scheme.
Open map →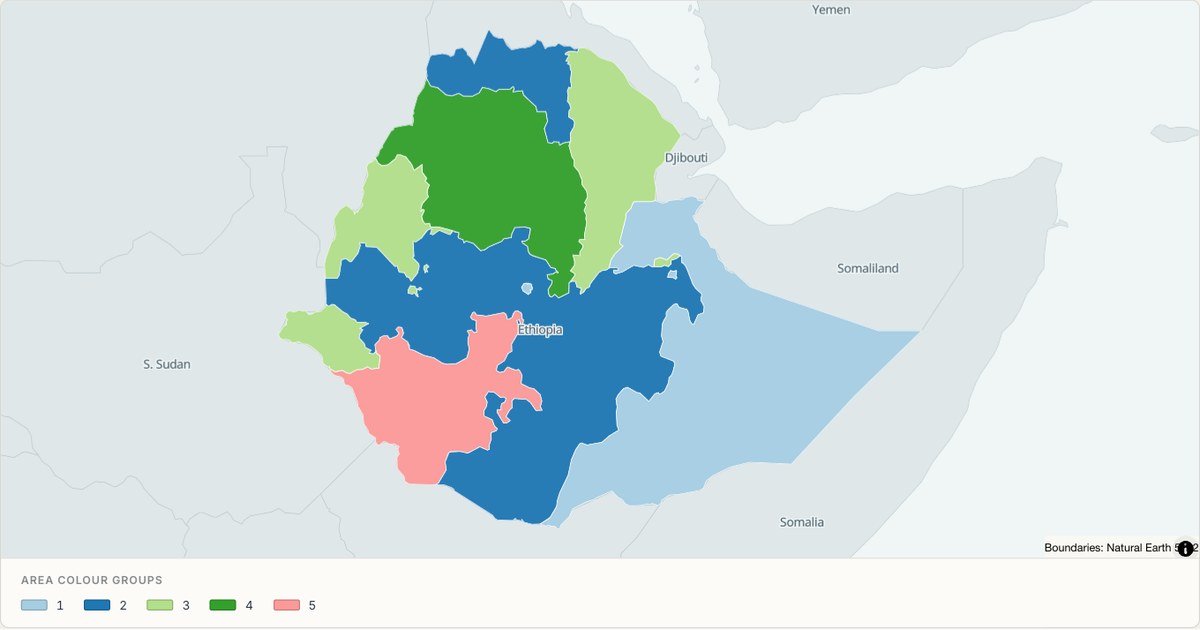 TopoJSONCategorical regions
Ethiopia administrative map
Explore 11 named areas in Ethiopia. Each boundary is selectable and carries a stable identifier, so you can add your own values or distinguish neighbouring areas with a categorical colour scheme.
Open map →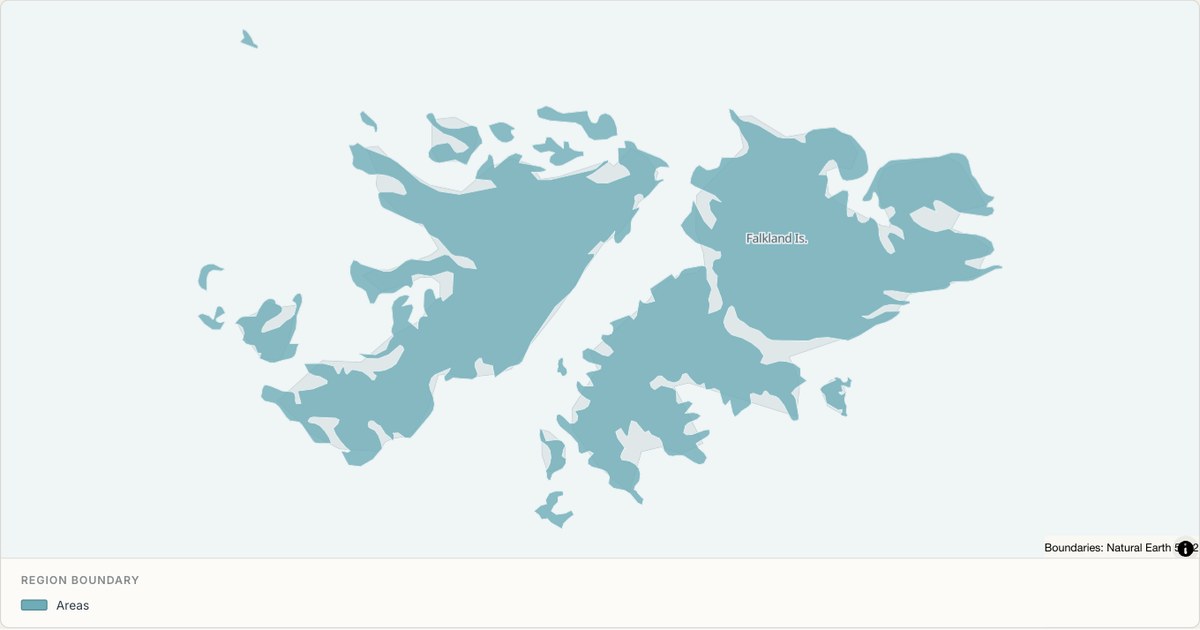 TopoJSONSingle boundary
Falkland Islands boundary map
Explore the boundary supplied for Falkland Islands. This snapshot contains one feature and does not provide internal subdivisions. Inspect its identifier and source attributes, or use it as a starting outline for your own map.
Open map →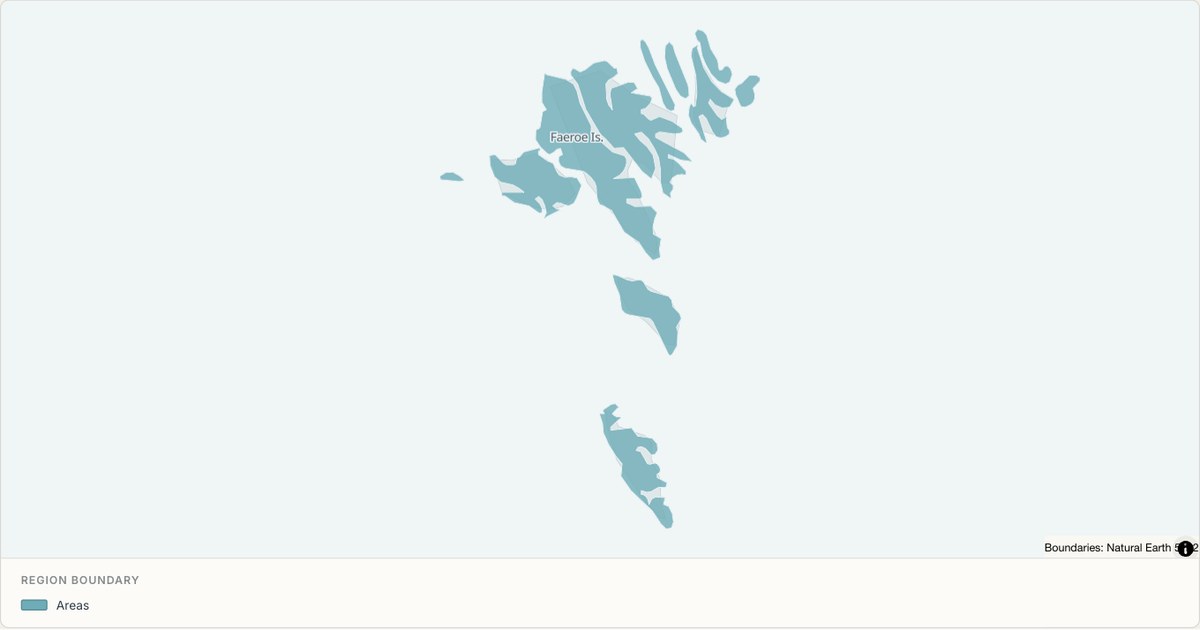 TopoJSONSingle boundary
Faroe Islands boundary map
Explore the boundary supplied for Faroe Islands. This snapshot contains one feature and does not provide internal subdivisions. Inspect its identifier and source attributes, or use it as a starting outline for your own map.
Open map →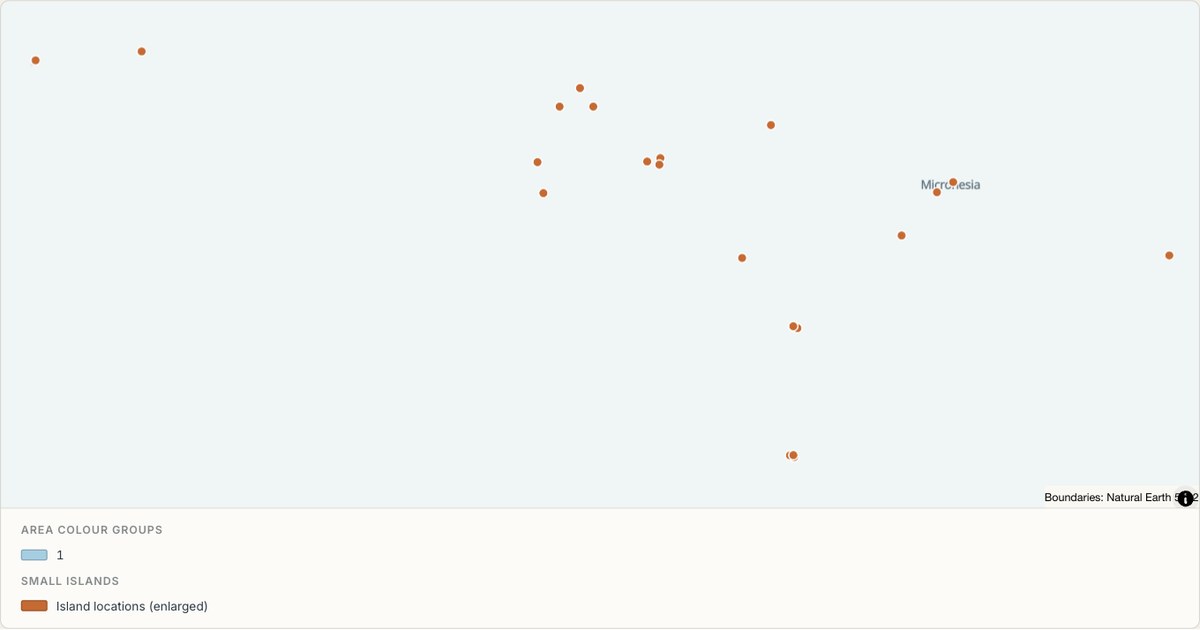 TopoJSONCategorical regions
Federated States of Micronesia administrative map
Explore 4 named areas in Federated States of Micronesia. Each boundary is selectable and carries a stable identifier, so you can add your own values or distinguish neighbouring areas with a categorical colour scheme.
Open map →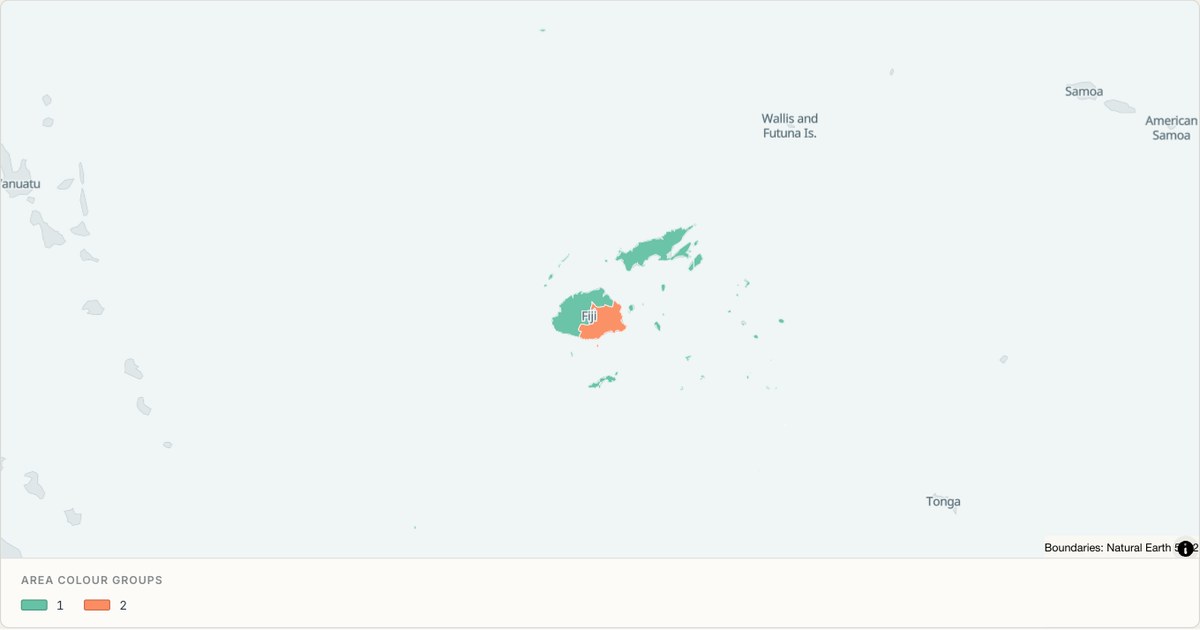 TopoJSONCategorical regions
Fiji administrative map
Explore 5 named areas in Fiji. Each boundary is selectable and carries a stable identifier, so you can add your own values or distinguish neighbouring areas with a categorical colour scheme.
Open map →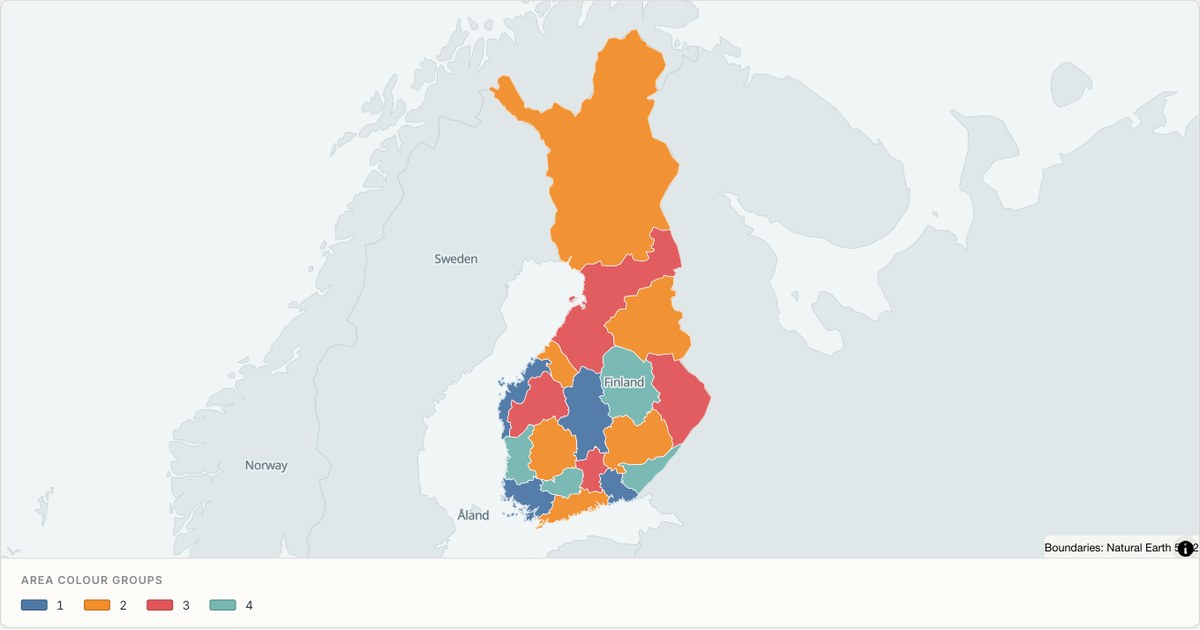 TopoJSONCategorical regions
Finland administrative map
Explore 18 named areas in Finland. Each boundary is selectable and carries a stable identifier, so you can add your own values or distinguish neighbouring areas with a categorical colour scheme.
Open map →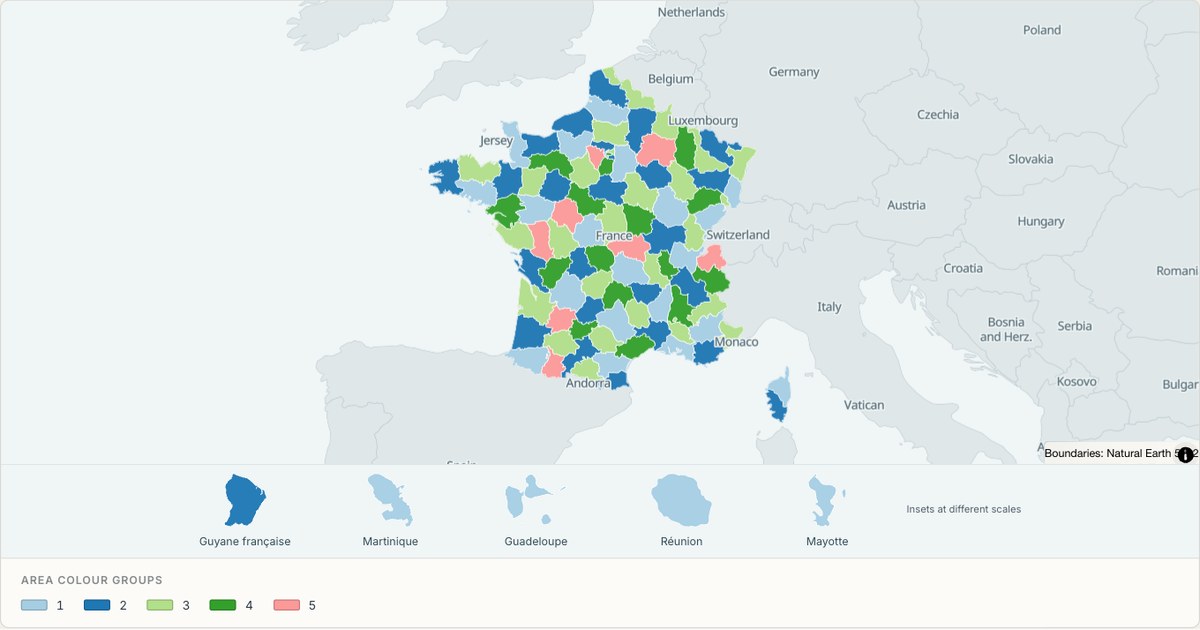 TopoJSONCategorical regions
France administrative map
Explore 101 named areas in France. Each boundary is selectable and carries a stable identifier, so you can add your own values or distinguish neighbouring areas with a categorical colour scheme.
Open map →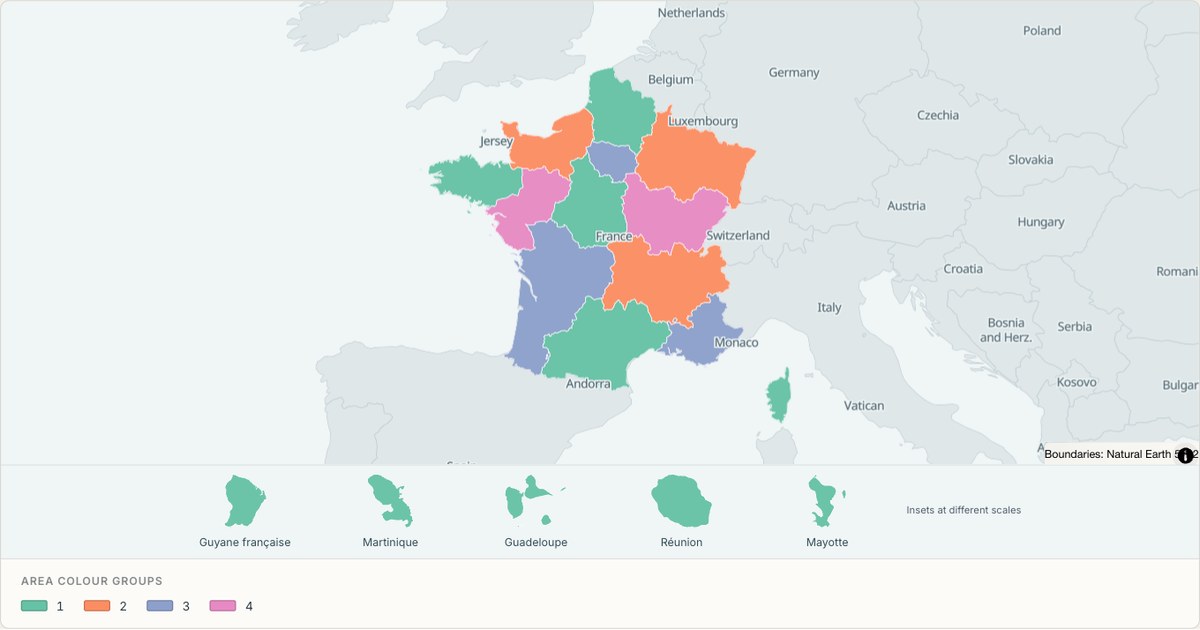 TopoJSONCategorical regions
France (regions) administrative map
Explore 18 named areas in France (regions). Each boundary is selectable and carries a stable identifier, so you can add your own values or distinguish neighbouring areas with a categorical colour scheme.
Open map →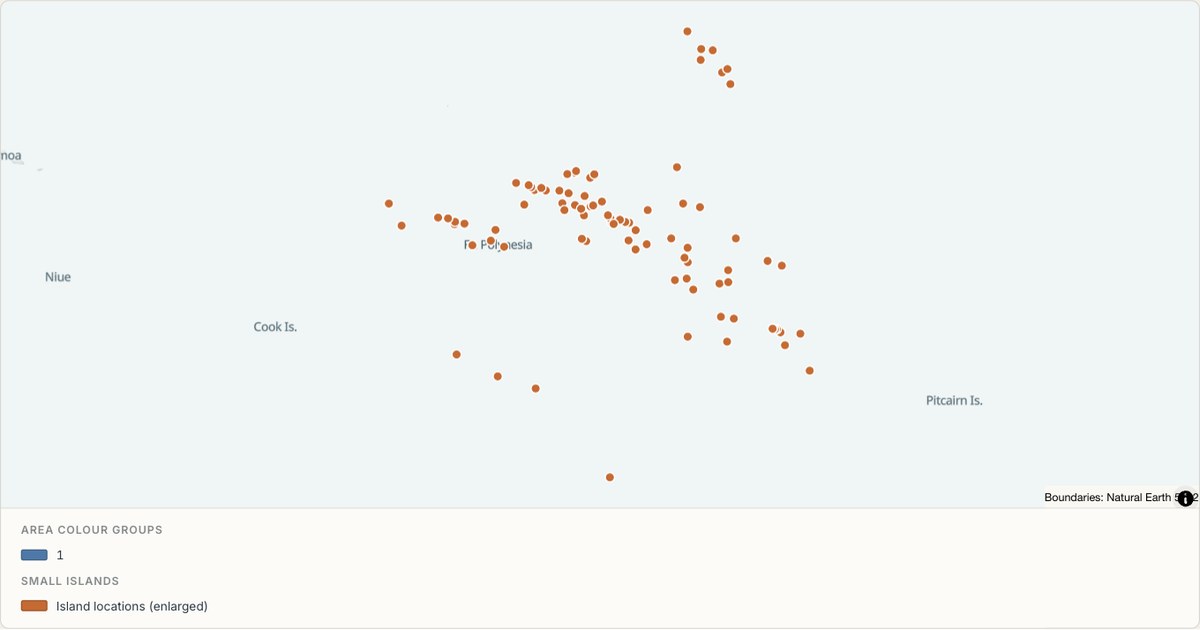 TopoJSONCategorical regions
French Polynesia administrative map
Explore 5 named areas in French Polynesia. Each boundary is selectable and carries a stable identifier, so you can add your own values or distinguish neighbouring areas with a categorical colour scheme.
Open map →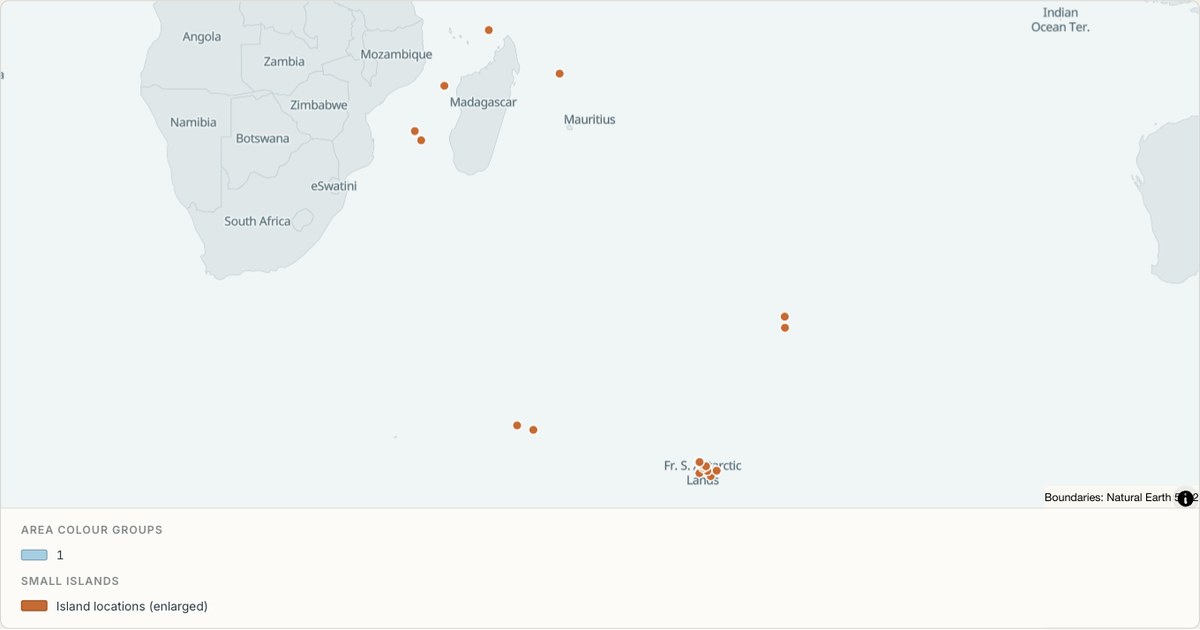 TopoJSONCategorical regions
French Southern and Antarctic Lands administrative map
Explore 4 named areas in French Southern and Antarctic Lands. Each boundary is selectable and carries a stable identifier, so you can add your own values or distinguish neighbouring areas with a categorical colour scheme.
Open map →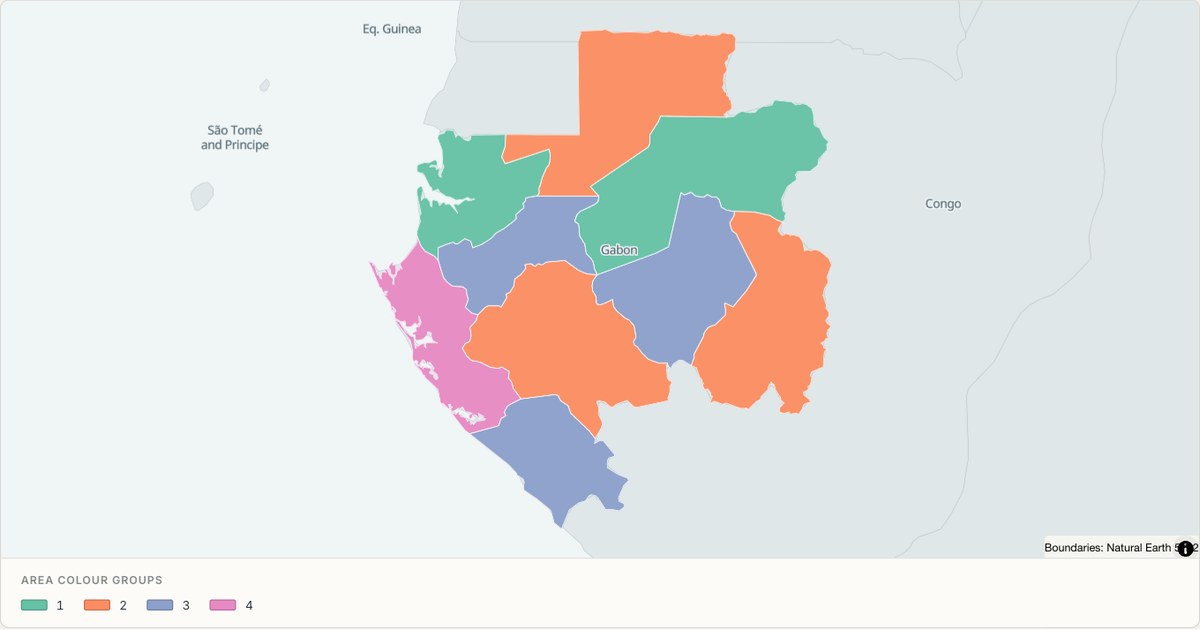 TopoJSONCategorical regions
Gabon administrative map
Explore 9 named areas in Gabon. Each boundary is selectable and carries a stable identifier, so you can add your own values or distinguish neighbouring areas with a categorical colour scheme.
Open map →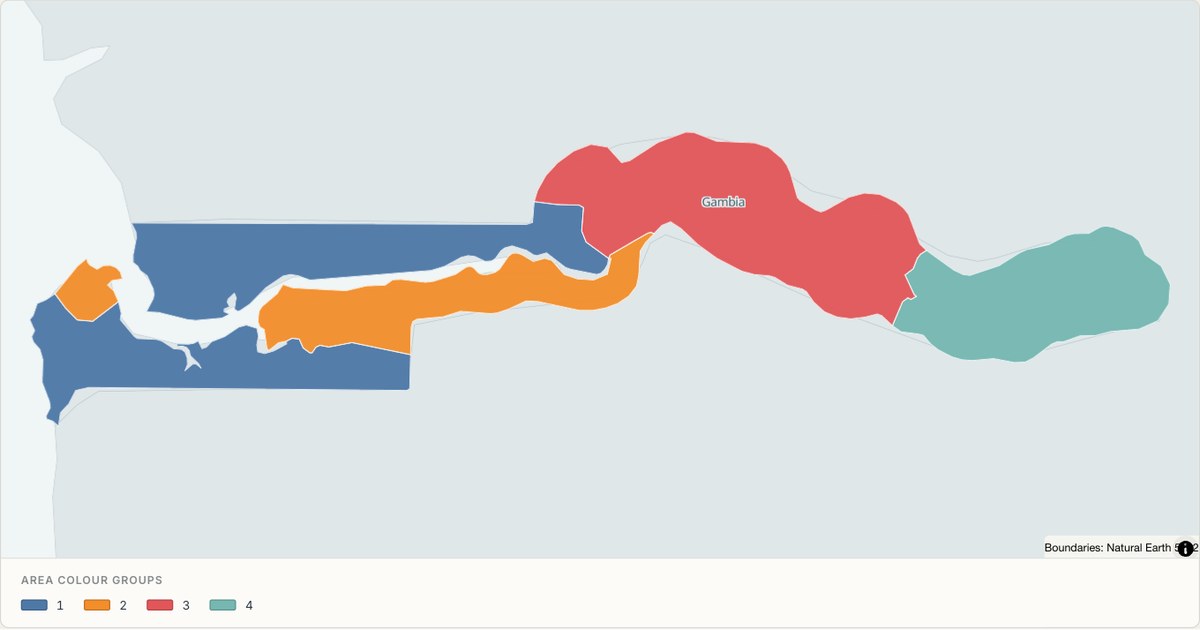 TopoJSONCategorical regions
Gambia administrative map
Explore 6 named areas in Gambia. Each boundary is selectable and carries a stable identifier, so you can add your own values or distinguish neighbouring areas with a categorical colour scheme.
Open map →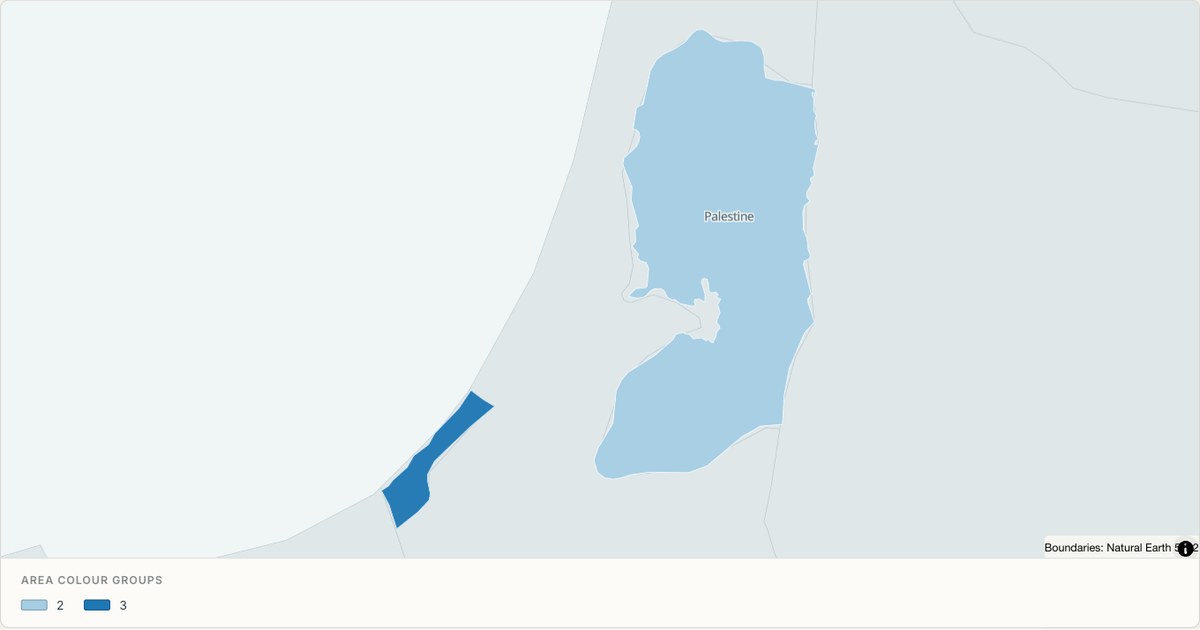 TopoJSONCategorical regions
Gaza Strip administrative map
Explore 2 named areas in Gaza Strip. Each boundary is selectable and carries a stable identifier, so you can add your own values or distinguish neighbouring areas with a categorical colour scheme.
Open map →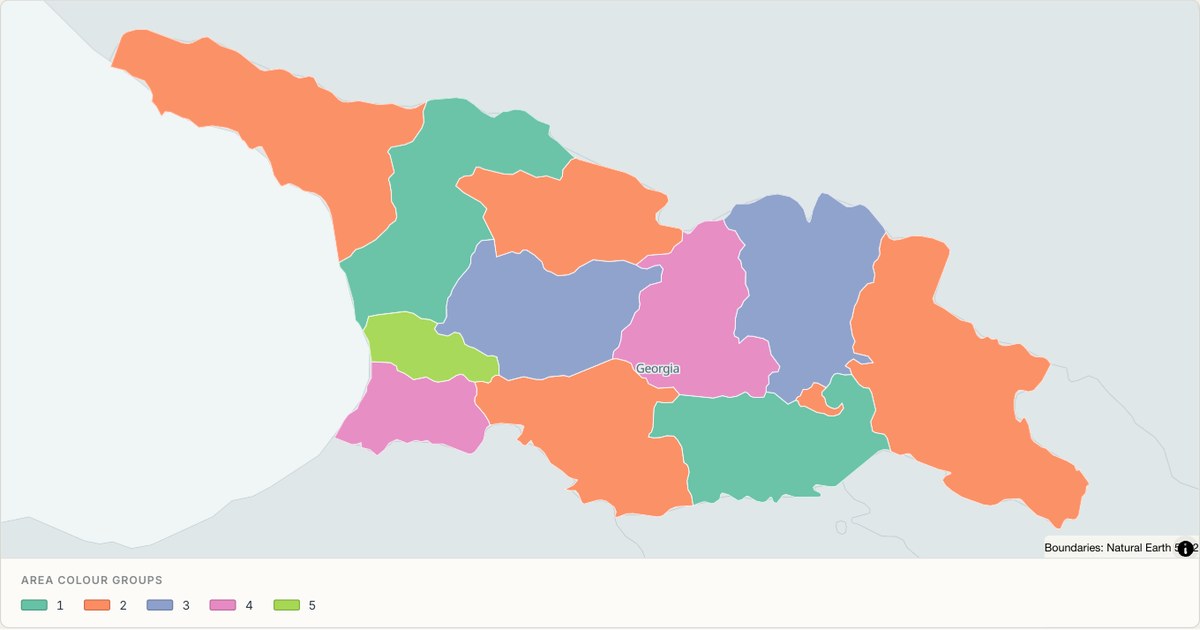 TopoJSONCategorical regions
Georgia administrative map
Explore 12 named areas in Georgia. Each boundary is selectable and carries a stable identifier, so you can add your own values or distinguish neighbouring areas with a categorical colour scheme.
Open map →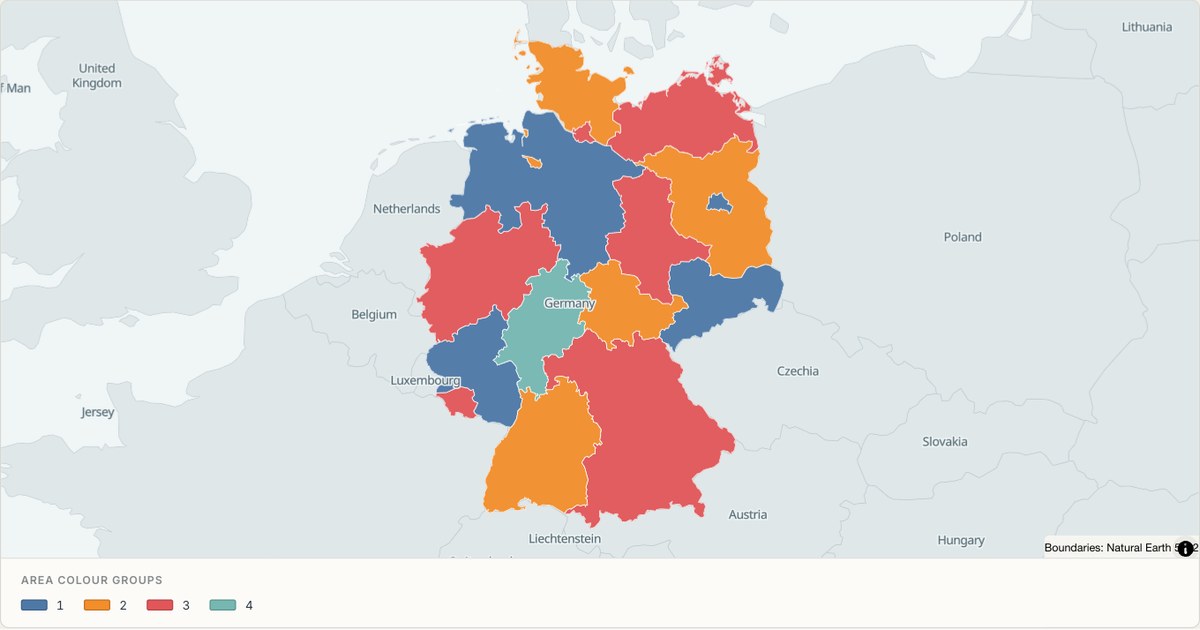 TopoJSONCategorical regions
Germany administrative map
Explore 16 named areas in Germany. Each boundary is selectable and carries a stable identifier, so you can add your own values or distinguish neighbouring areas with a categorical colour scheme.
Open map →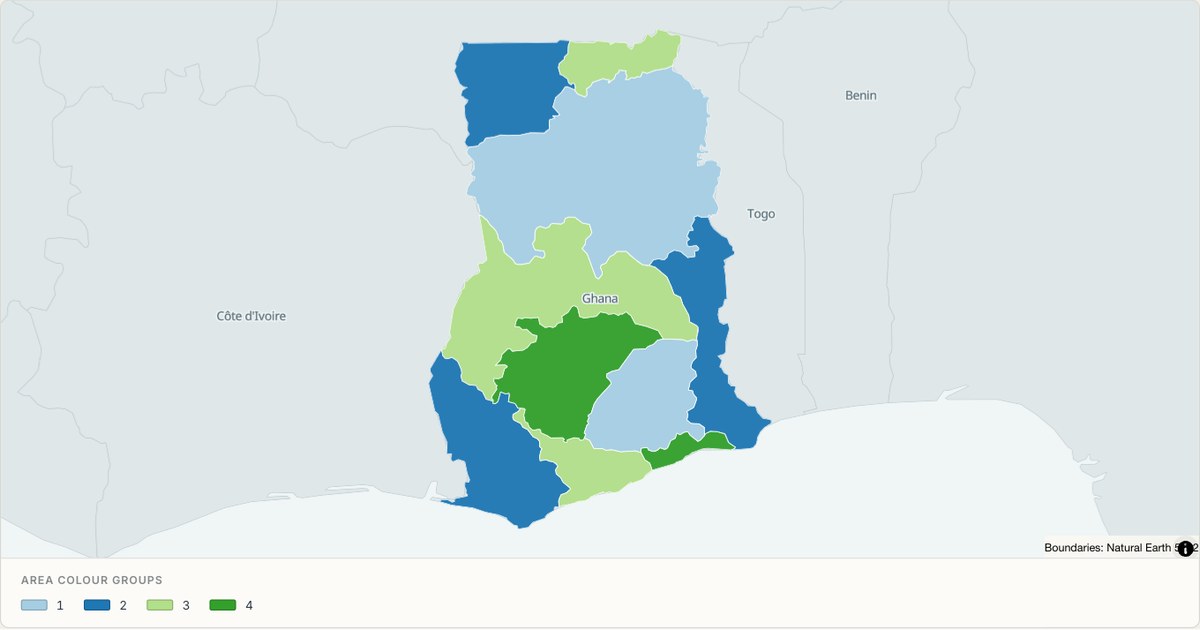 TopoJSONCategorical regions
Ghana administrative map
Explore 10 named areas in Ghana. Each boundary is selectable and carries a stable identifier, so you can add your own values or distinguish neighbouring areas with a categorical colour scheme.
Open map →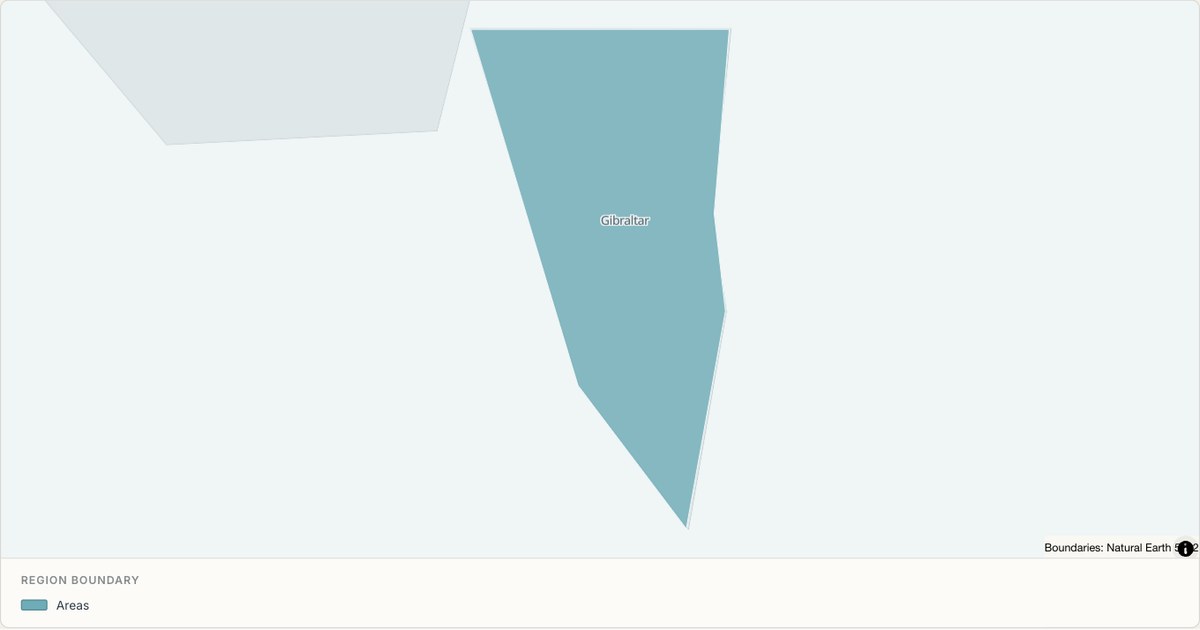 TopoJSONSingle boundary
Gibraltar boundary map
Explore the boundary supplied for Gibraltar. This snapshot contains one feature and does not provide internal subdivisions. Inspect its identifier and source attributes, or use it as a starting outline for your own map.
Open map →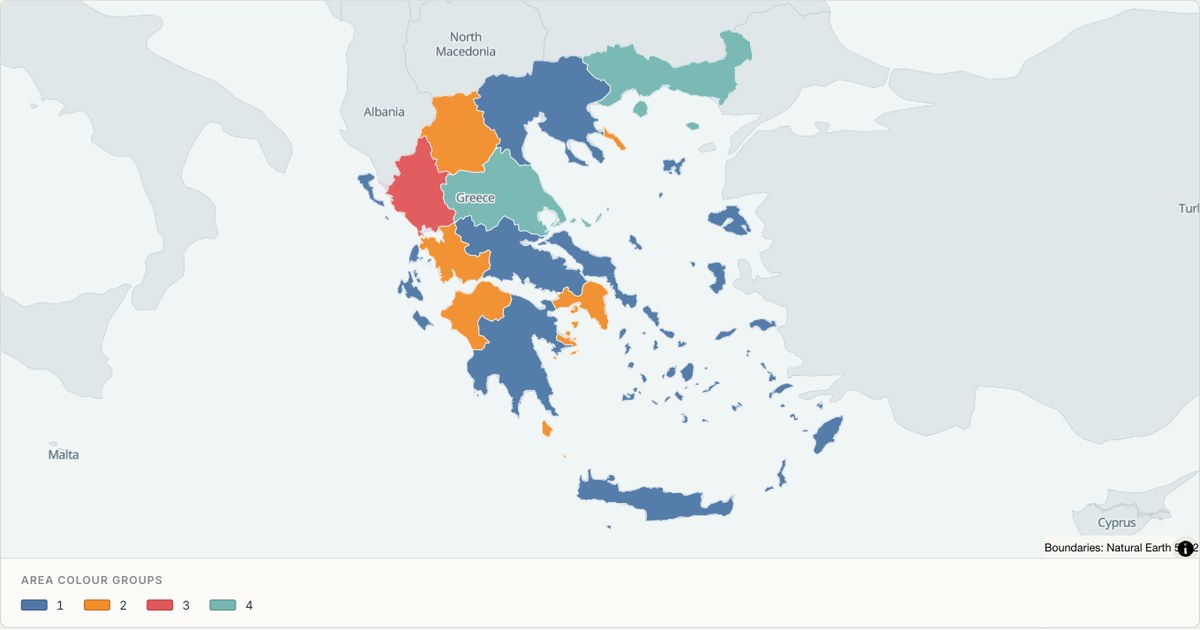 TopoJSONCategorical regions
Greece administrative map
Explore 14 named areas in Greece. Each boundary is selectable and carries a stable identifier, so you can add your own values or distinguish neighbouring areas with a categorical colour scheme.
Open map →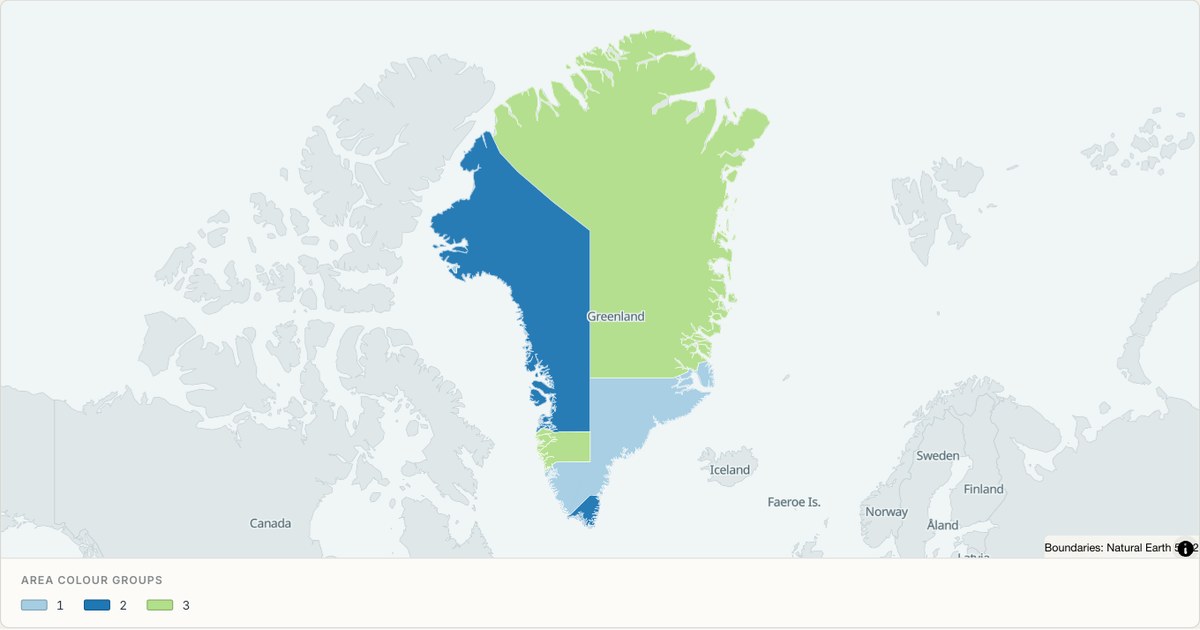 TopoJSONCategorical regions
Greenland administrative map
Explore 6 named areas in Greenland. Each boundary is selectable and carries a stable identifier, so you can add your own values or distinguish neighbouring areas with a categorical colour scheme.
Open map →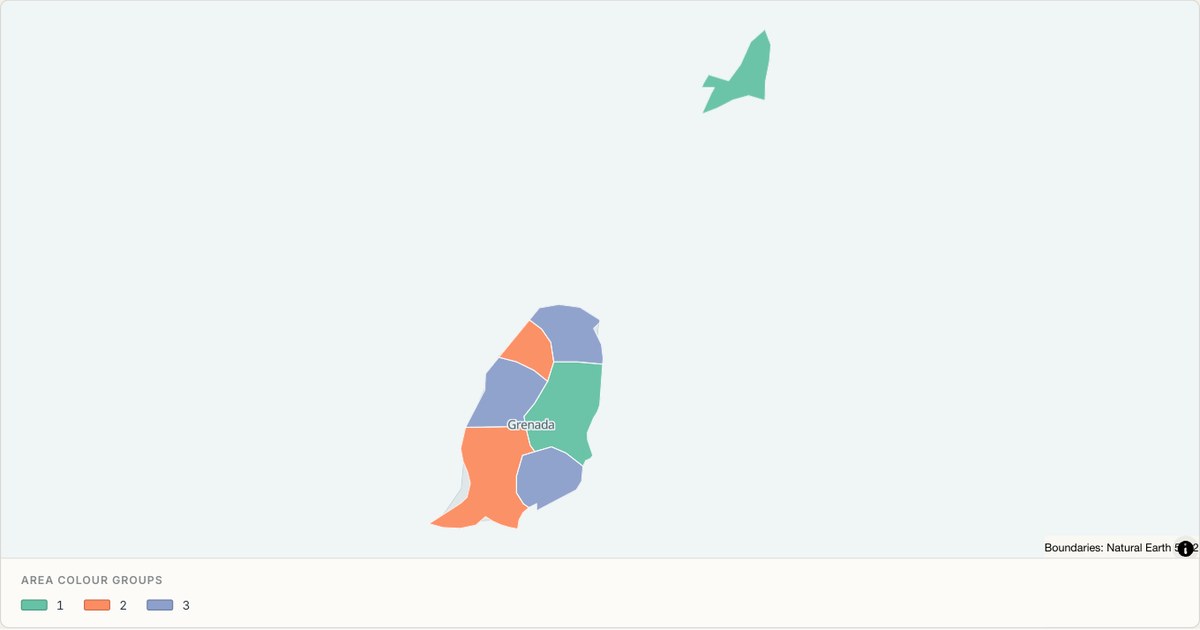 TopoJSONCategorical regions
Grenada administrative map
Explore 7 named areas in Grenada. Each boundary is selectable and carries a stable identifier, so you can add your own values or distinguish neighbouring areas with a categorical colour scheme.
Open map →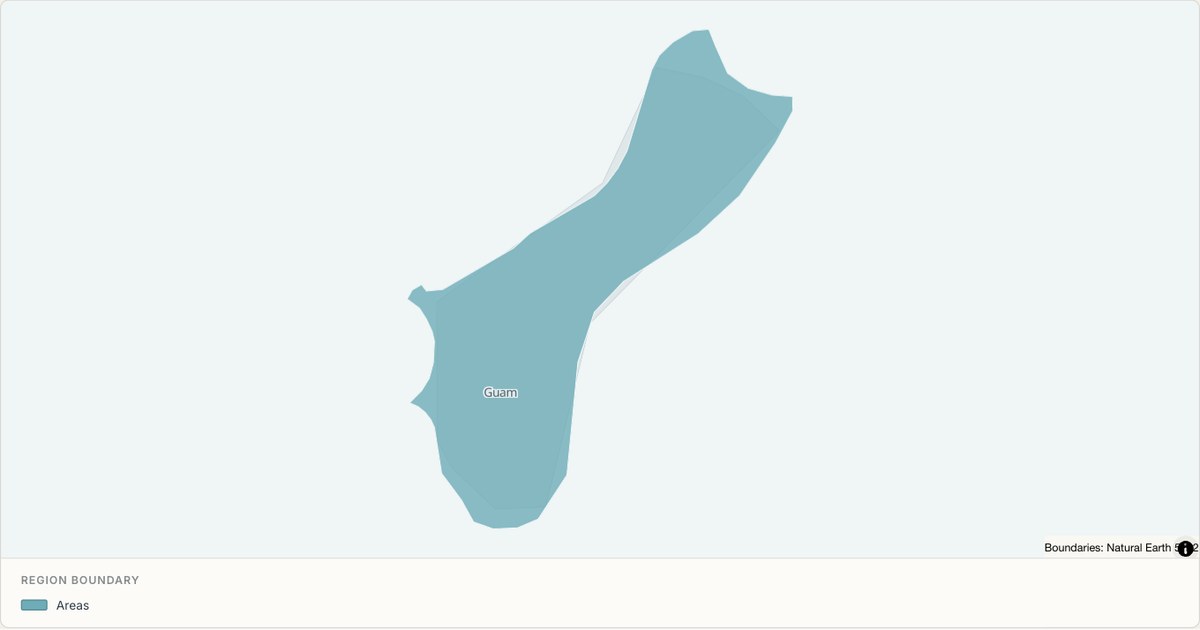 TopoJSONSingle boundary
Guam boundary map
Explore the boundary supplied for Guam. This snapshot contains one feature and does not provide internal subdivisions. Inspect its identifier and source attributes, or use it as a starting outline for your own map.
Open map →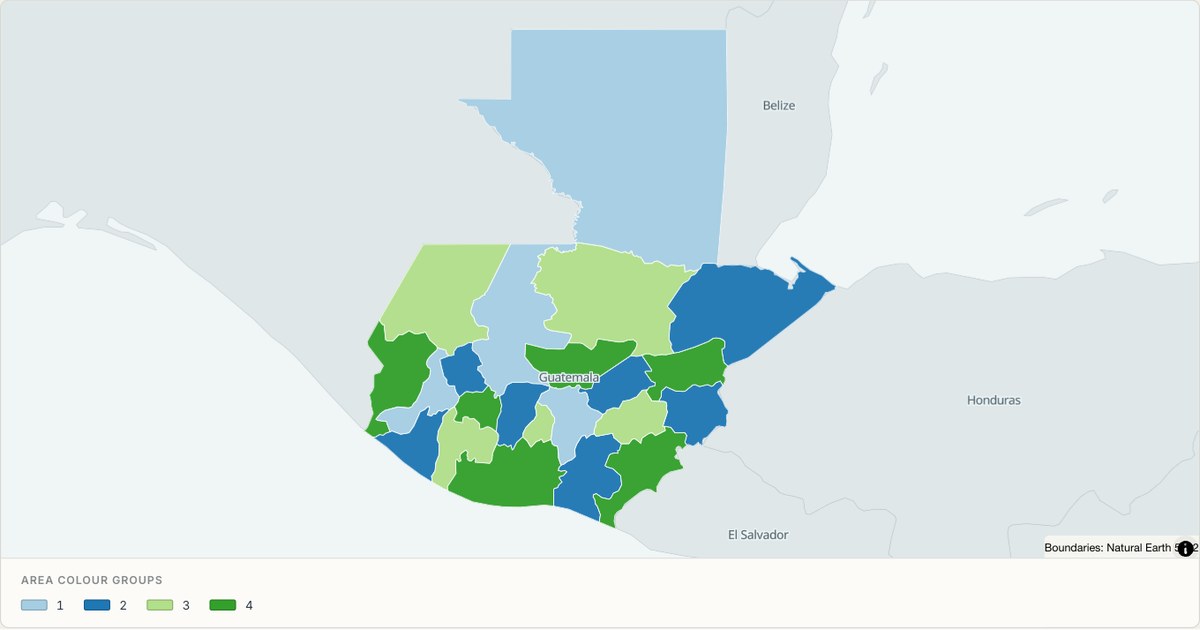 TopoJSONCategorical regions
Guatemala administrative map
Explore 22 named areas in Guatemala. Each boundary is selectable and carries a stable identifier, so you can add your own values or distinguish neighbouring areas with a categorical colour scheme.
Open map →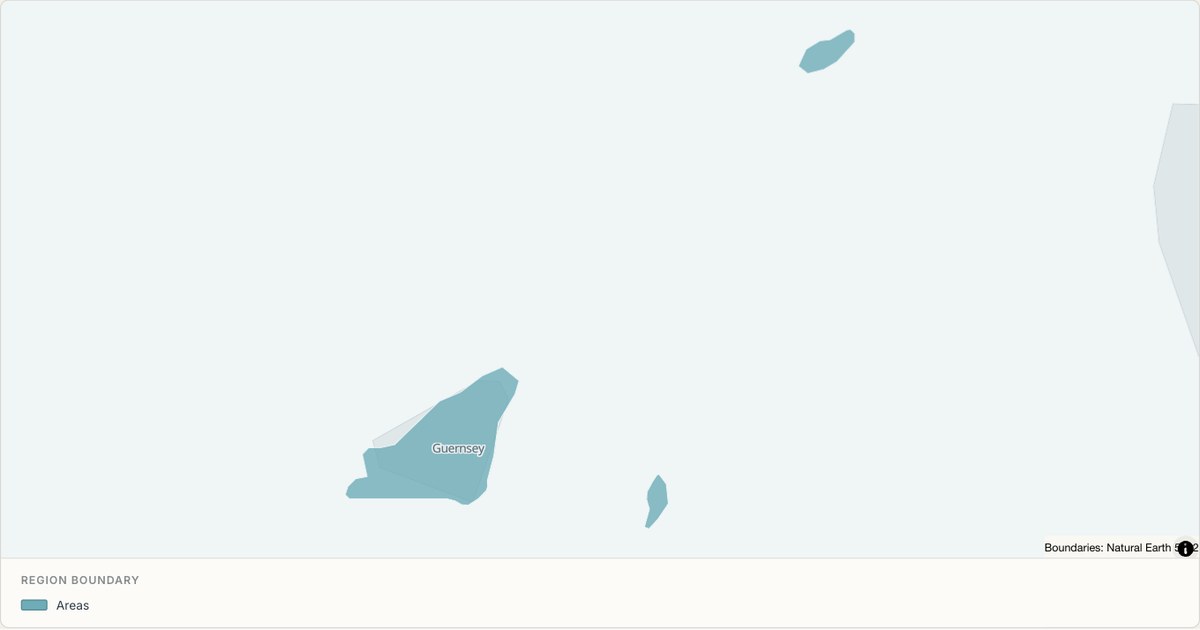 TopoJSONSingle boundary
Guernsey boundary map
Explore the boundary supplied for Guernsey. This snapshot contains one feature and does not provide internal subdivisions. Inspect its identifier and source attributes, or use it as a starting outline for your own map.
Open map →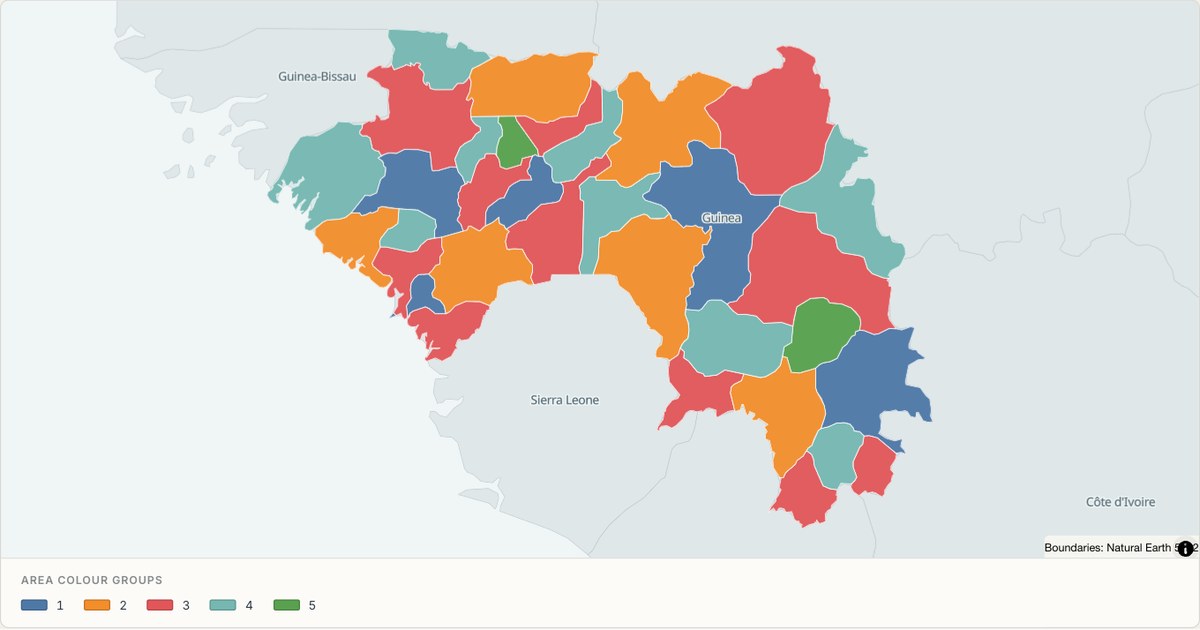 TopoJSONCategorical regions
Guinea administrative map
Explore 34 named areas in Guinea. Each boundary is selectable and carries a stable identifier, so you can add your own values or distinguish neighbouring areas with a categorical colour scheme.
Open map →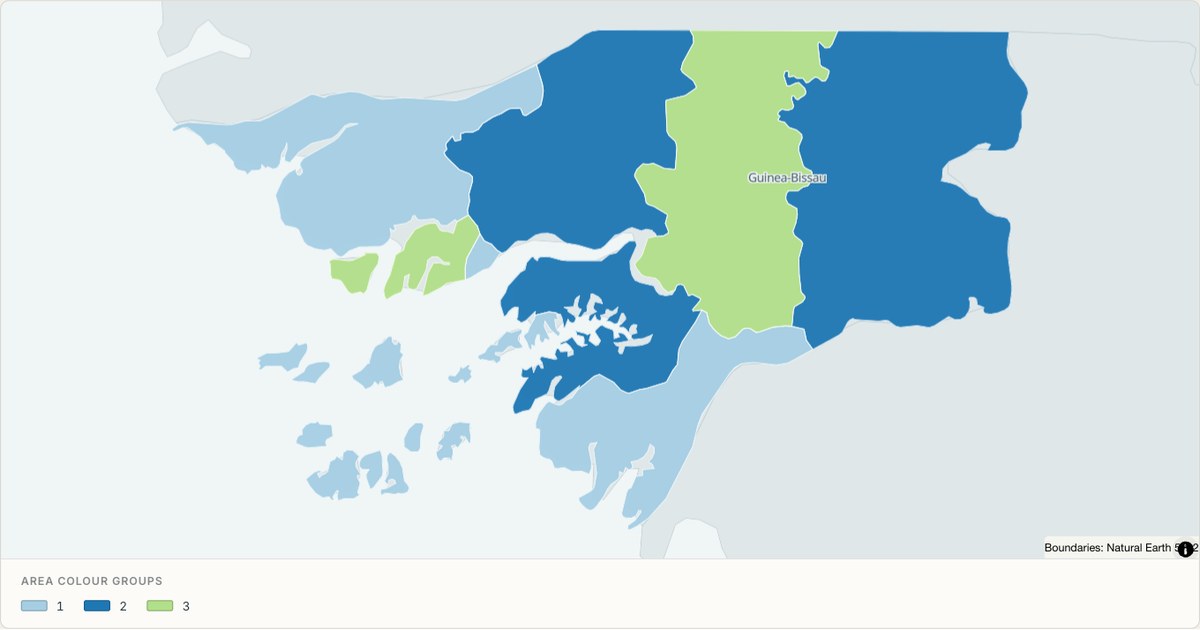 TopoJSONCategorical regions
Guinea Bissau administrative map
Explore 9 named areas in Guinea Bissau. Each boundary is selectable and carries a stable identifier, so you can add your own values or distinguish neighbouring areas with a categorical colour scheme.
Open map →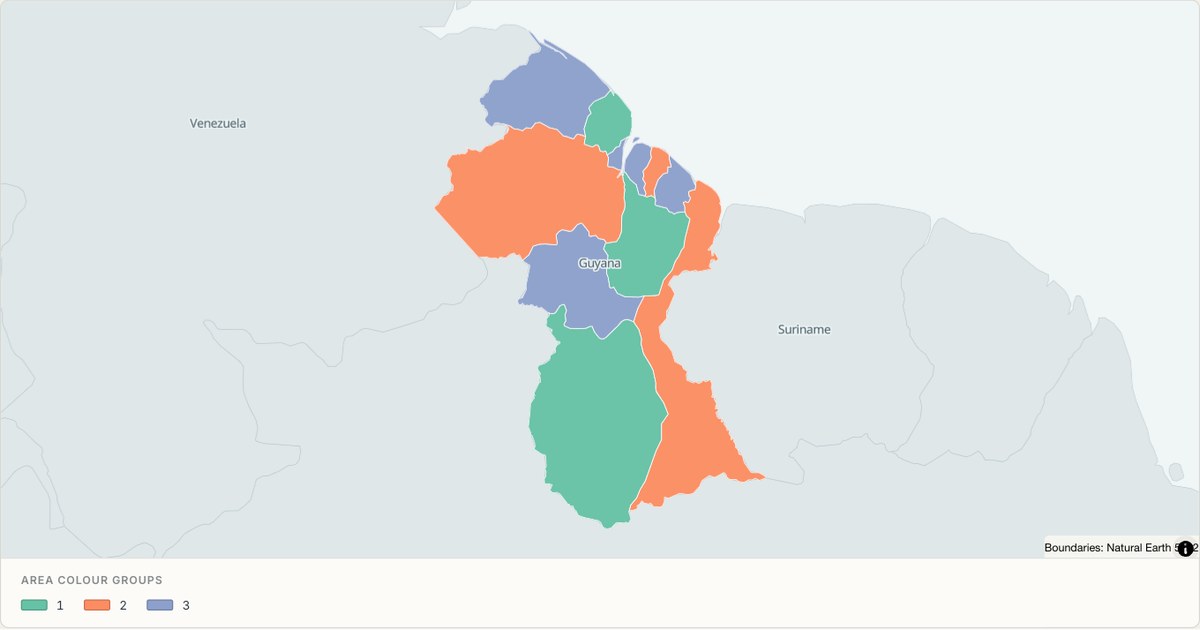 TopoJSONCategorical regions
Guyana administrative map
Explore 10 named areas in Guyana. Each boundary is selectable and carries a stable identifier, so you can add your own values or distinguish neighbouring areas with a categorical colour scheme.
Open map →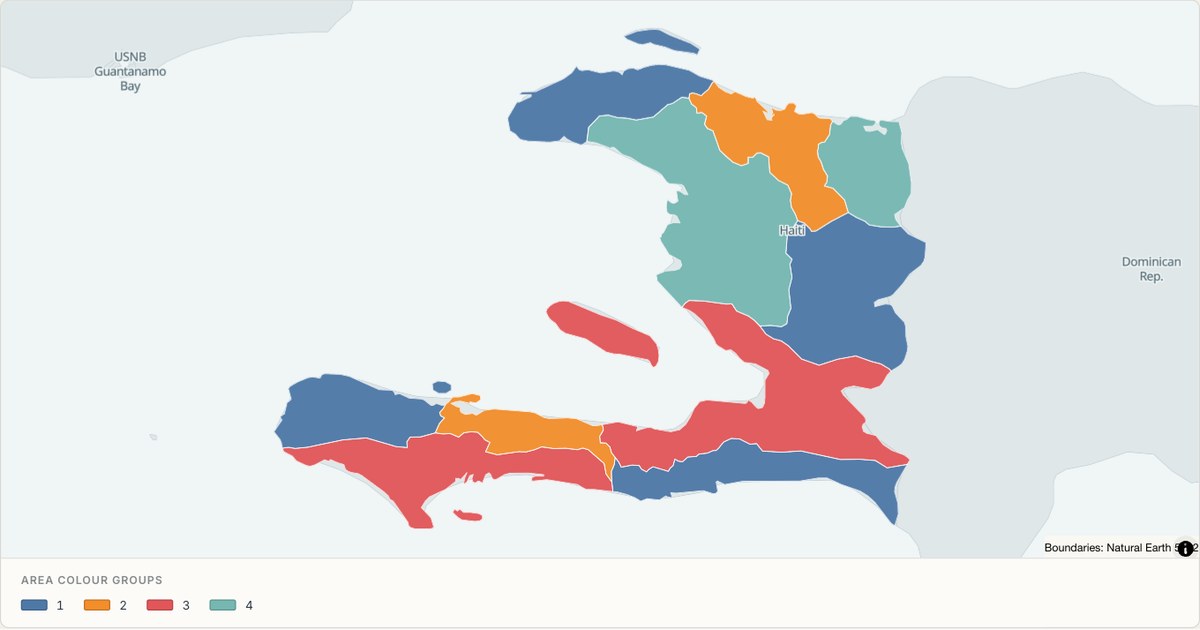 TopoJSONCategorical regions
Haiti administrative map
Explore 10 named areas in Haiti. Each boundary is selectable and carries a stable identifier, so you can add your own values or distinguish neighbouring areas with a categorical colour scheme.
Open map →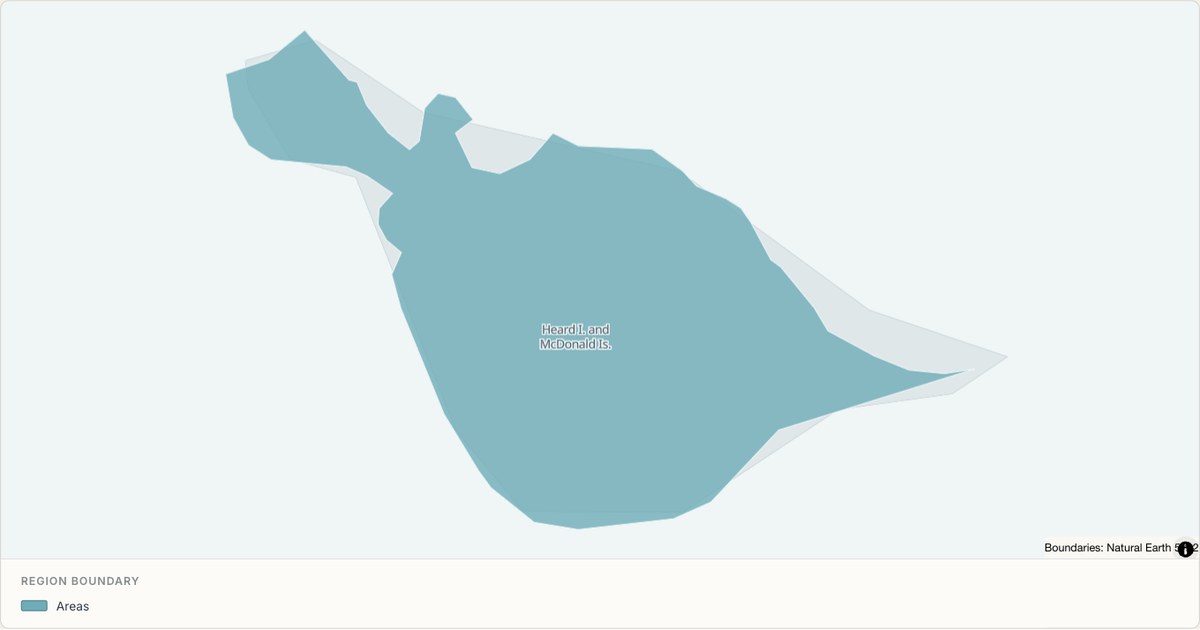 TopoJSONSingle boundary
Heard Island and McDonald Islands boundary map
Explore the boundary supplied for Heard Island and McDonald Islands. This snapshot contains one feature and does not provide internal subdivisions. Inspect its identifier and source attributes, or use it as a starting outline for your own map.
Open map →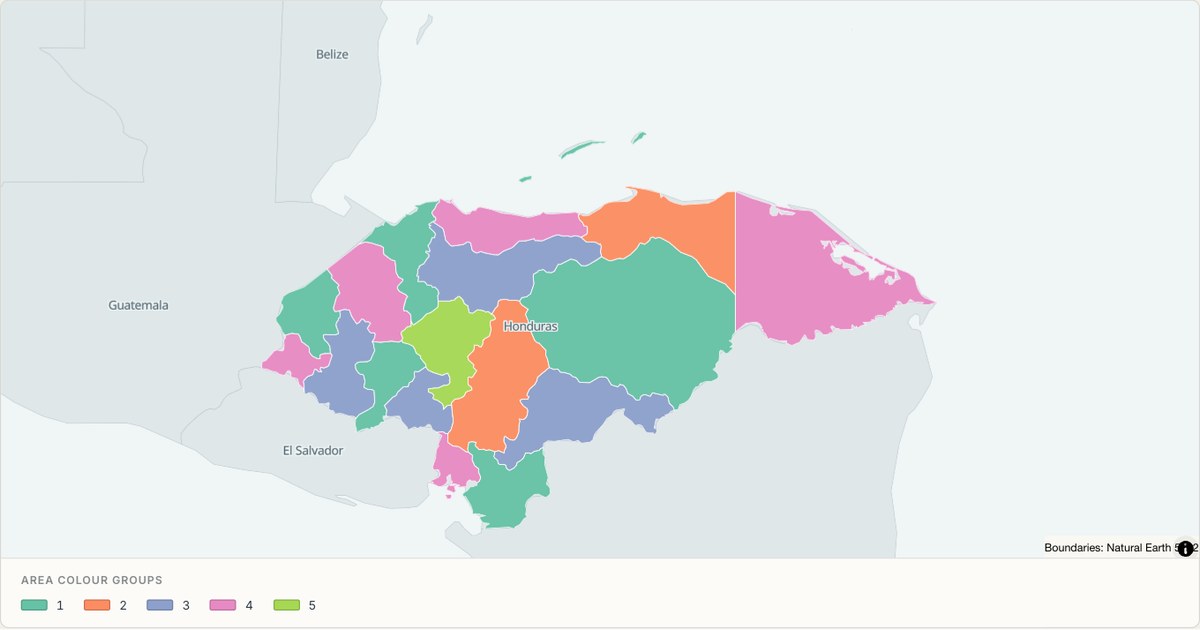 TopoJSONCategorical regions
Honduras administrative map
Explore 18 named areas in Honduras. Each boundary is selectable and carries a stable identifier, so you can add your own values or distinguish neighbouring areas with a categorical colour scheme.
Open map →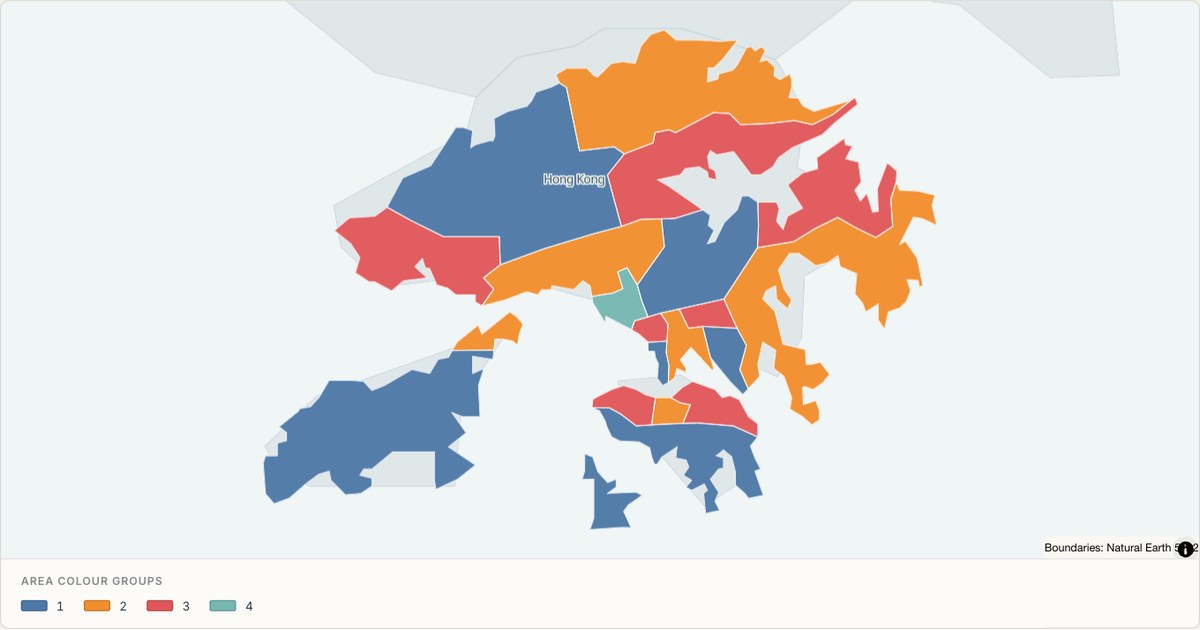 TopoJSONCategorical regions
Hong Kong S.A.R. administrative map
Explore 18 named areas in Hong Kong S.A.R.. Each boundary is selectable and carries a stable identifier, so you can add your own values or distinguish neighbouring areas with a categorical colour scheme.
Open map →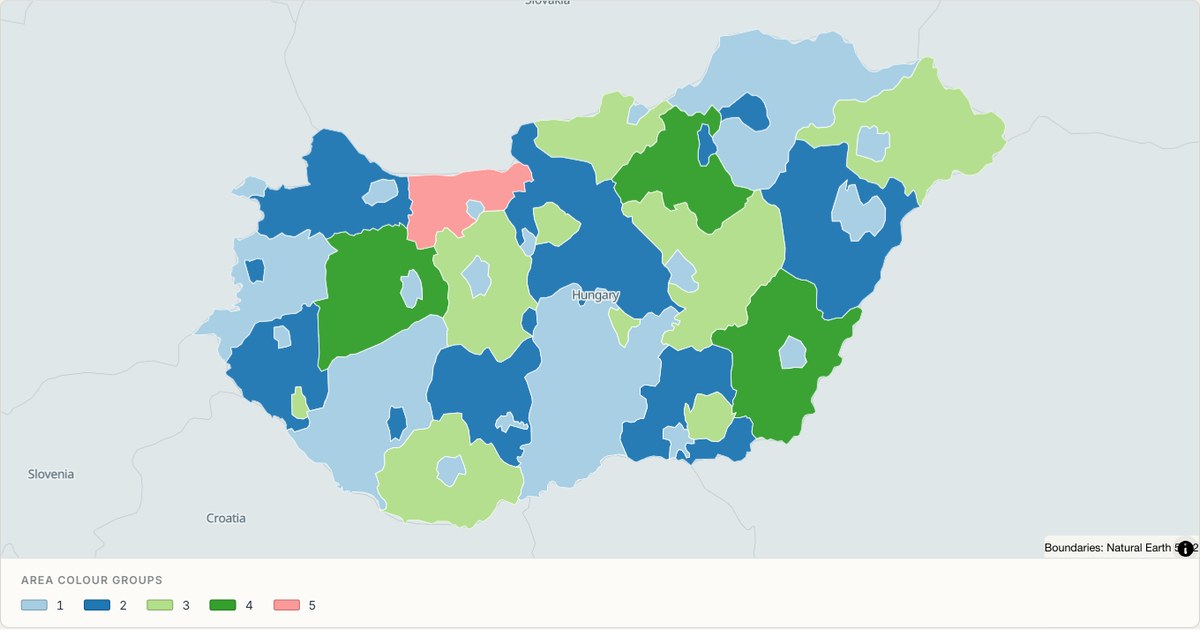 TopoJSONCategorical regions
Hungary administrative map
Explore 43 named areas in Hungary. Each boundary is selectable and carries a stable identifier, so you can add your own values or distinguish neighbouring areas with a categorical colour scheme.
Open map →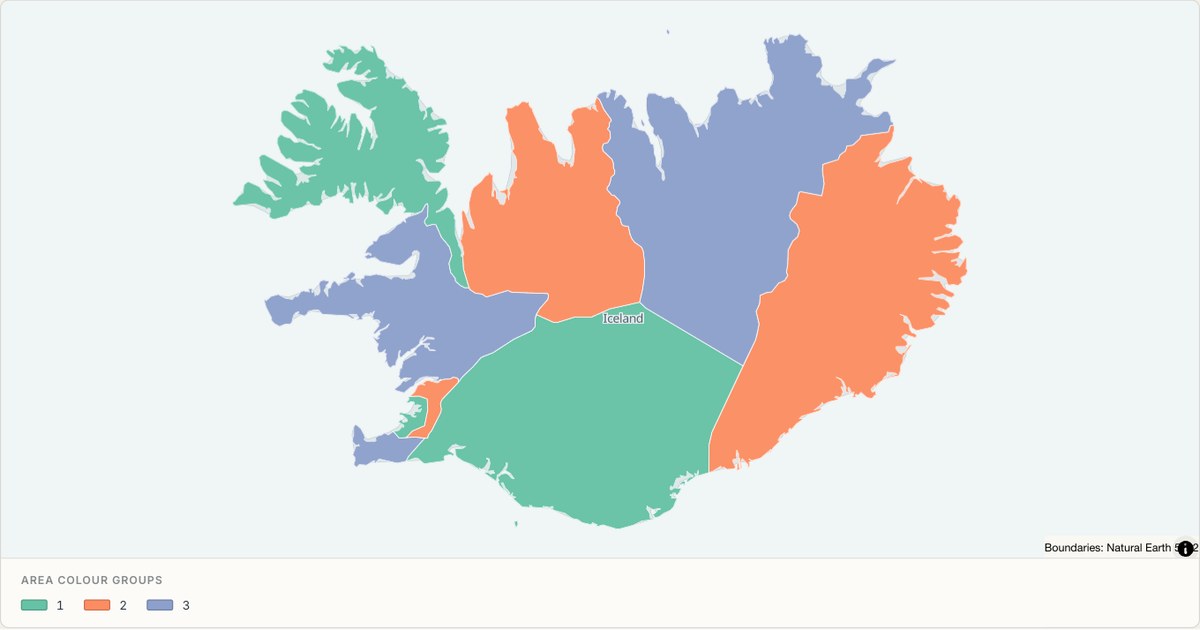 TopoJSONCategorical regions
Iceland administrative map
Explore 9 named areas in Iceland. Each boundary is selectable and carries a stable identifier, so you can add your own values or distinguish neighbouring areas with a categorical colour scheme.
Open map →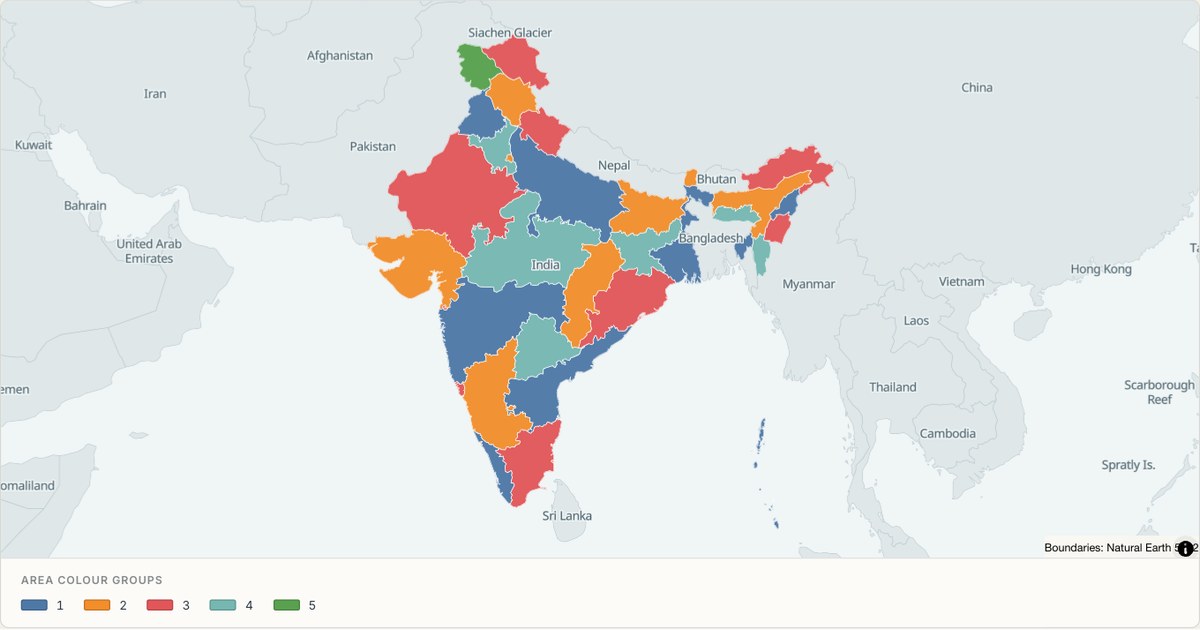 TopoJSONCategorical regions
India administrative map
Explore 36 named areas in India. Each boundary is selectable and carries a stable identifier, so you can add your own values or distinguish neighbouring areas with a categorical colour scheme.
Open map →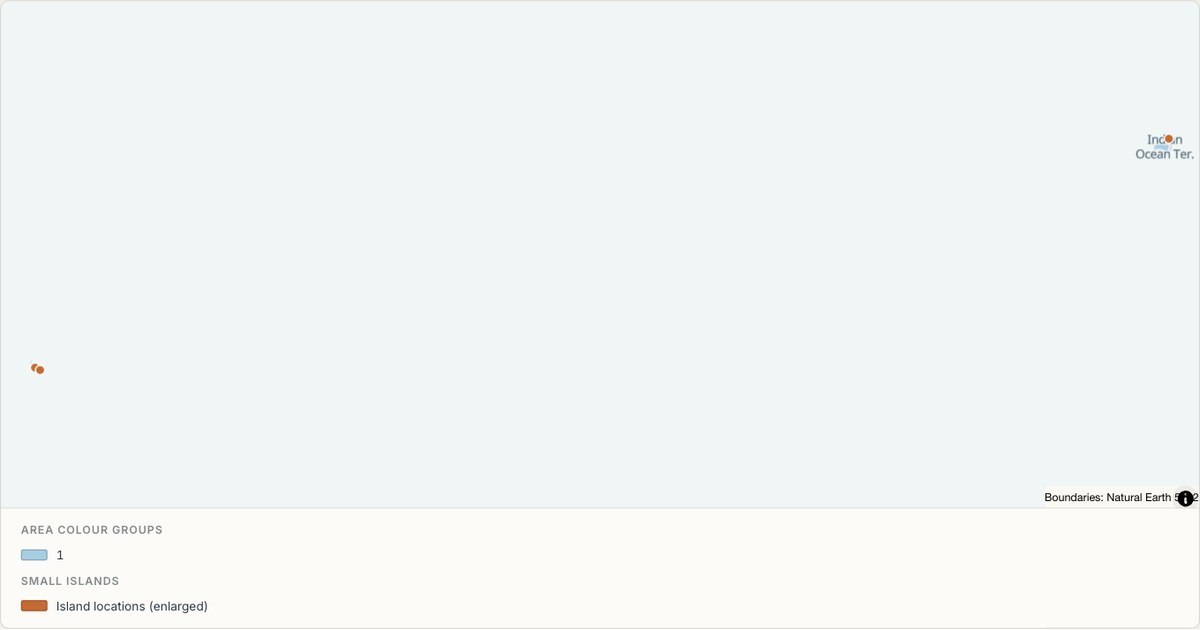 TopoJSONCategorical regions
Indian Ocean Territories administrative map
Explore 2 named areas in Indian Ocean Territories. Each boundary is selectable and carries a stable identifier, so you can add your own values or distinguish neighbouring areas with a categorical colour scheme.
Open map →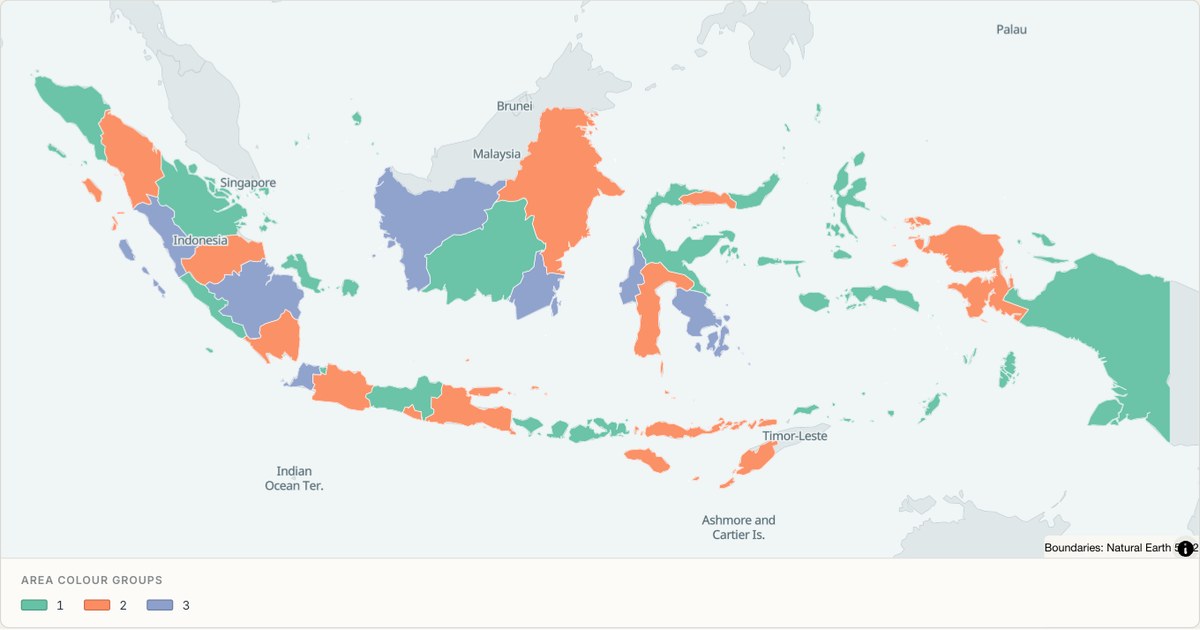 TopoJSONCategorical regions
Indonesia administrative map
Explore 33 named areas in Indonesia. Each boundary is selectable and carries a stable identifier, so you can add your own values or distinguish neighbouring areas with a categorical colour scheme.
Open map →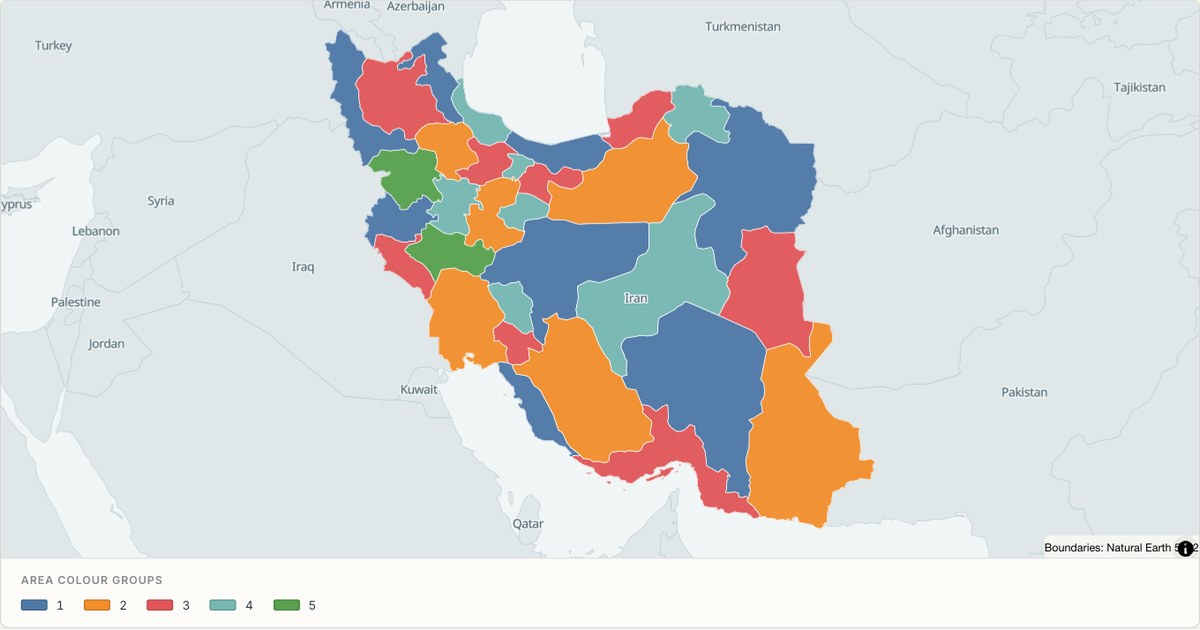 TopoJSONCategorical regions
Iran administrative map
Explore 31 named areas in Iran. Each boundary is selectable and carries a stable identifier, so you can add your own values or distinguish neighbouring areas with a categorical colour scheme.
Open map →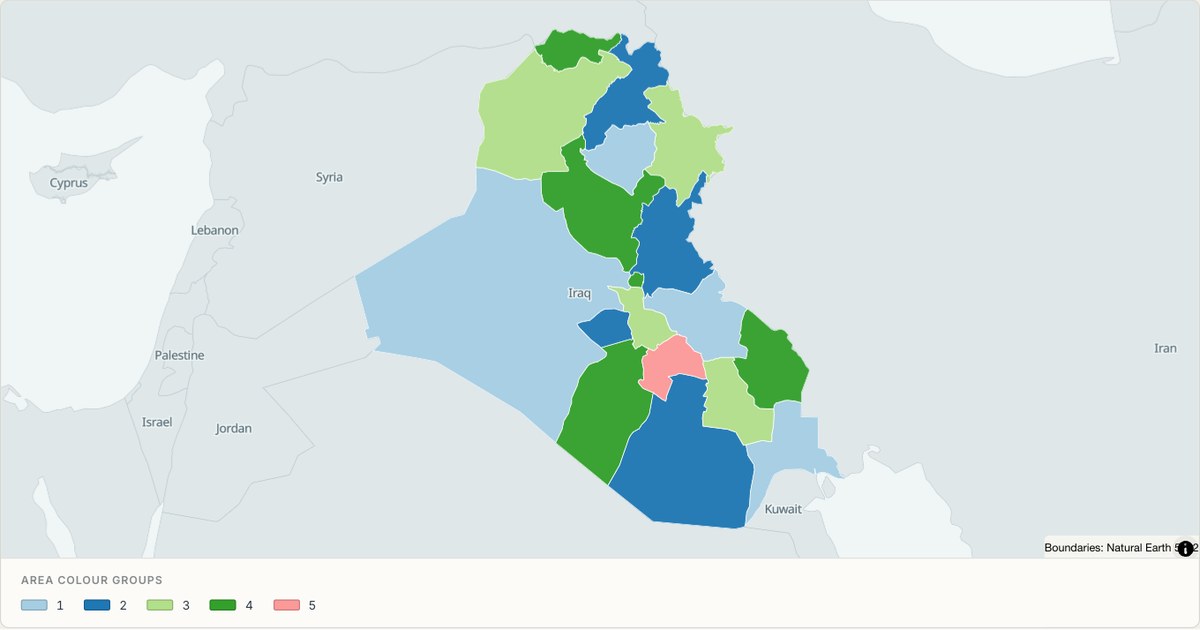 TopoJSONCategorical regions
Iraq administrative map
Explore 18 named areas in Iraq. Each boundary is selectable and carries a stable identifier, so you can add your own values or distinguish neighbouring areas with a categorical colour scheme.
Open map →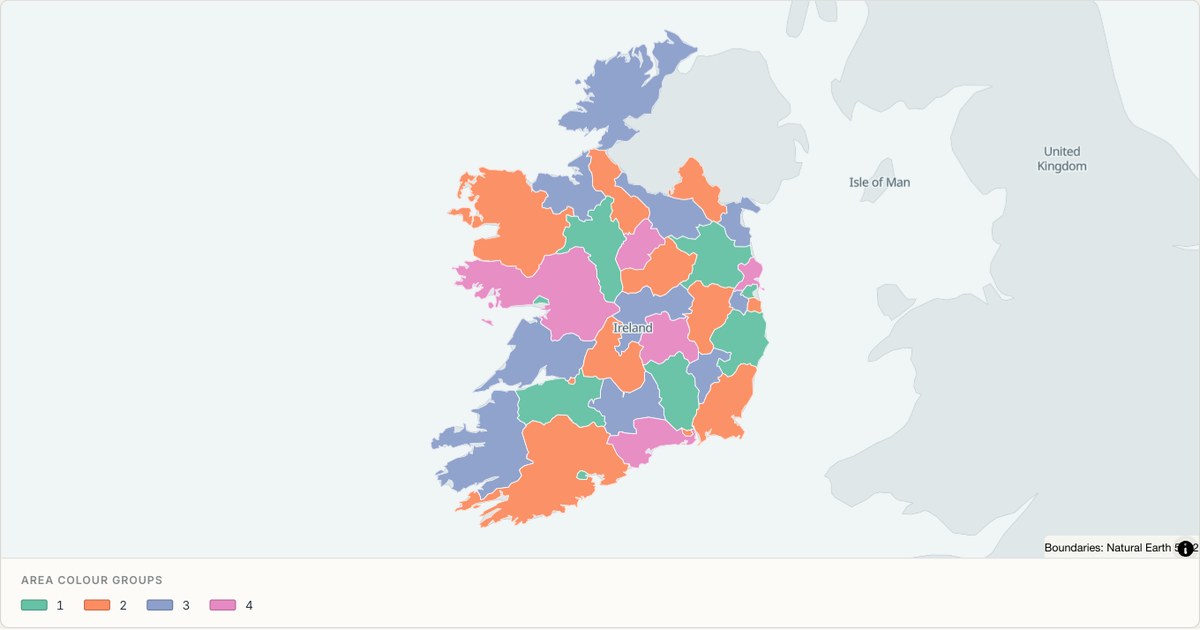 TopoJSONCategorical regions
Ireland administrative map
Explore 34 named areas in Ireland. Each boundary is selectable and carries a stable identifier, so you can add your own values or distinguish neighbouring areas with a categorical colour scheme.
Open map →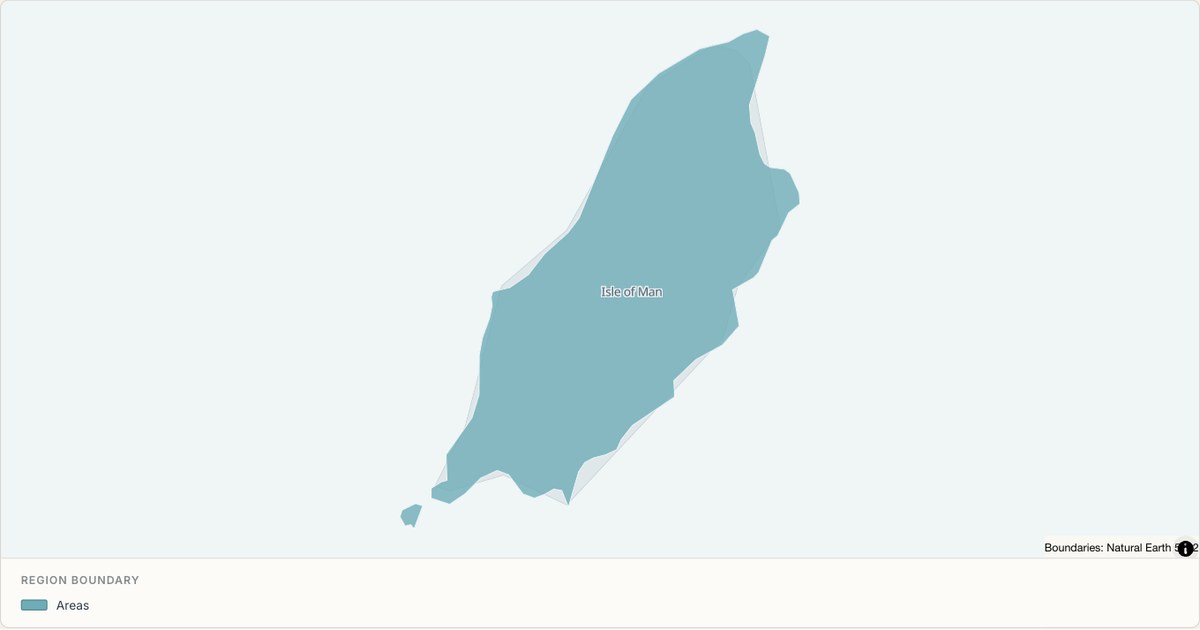 TopoJSONSingle boundary
Isle of Man boundary map
Explore the boundary supplied for Isle of Man. This snapshot contains one feature and does not provide internal subdivisions. Inspect its identifier and source attributes, or use it as a starting outline for your own map.
Open map →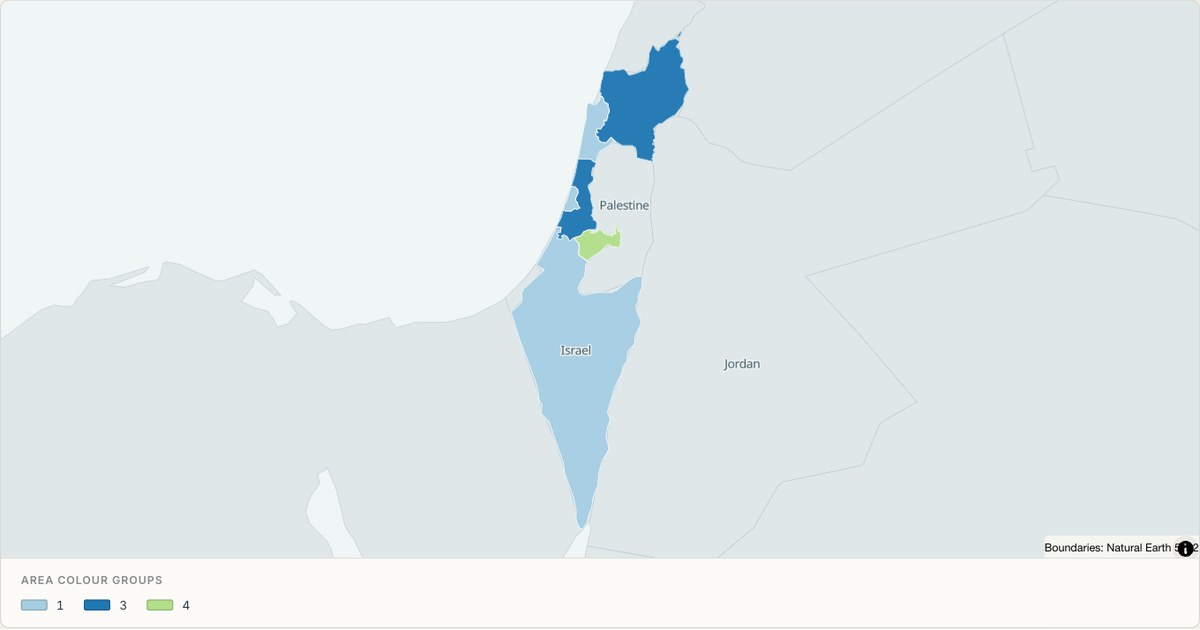 TopoJSONCategorical regions
Israel administrative map
Explore 6 named areas in Israel. Each boundary is selectable and carries a stable identifier, so you can add your own values or distinguish neighbouring areas with a categorical colour scheme.
Open map →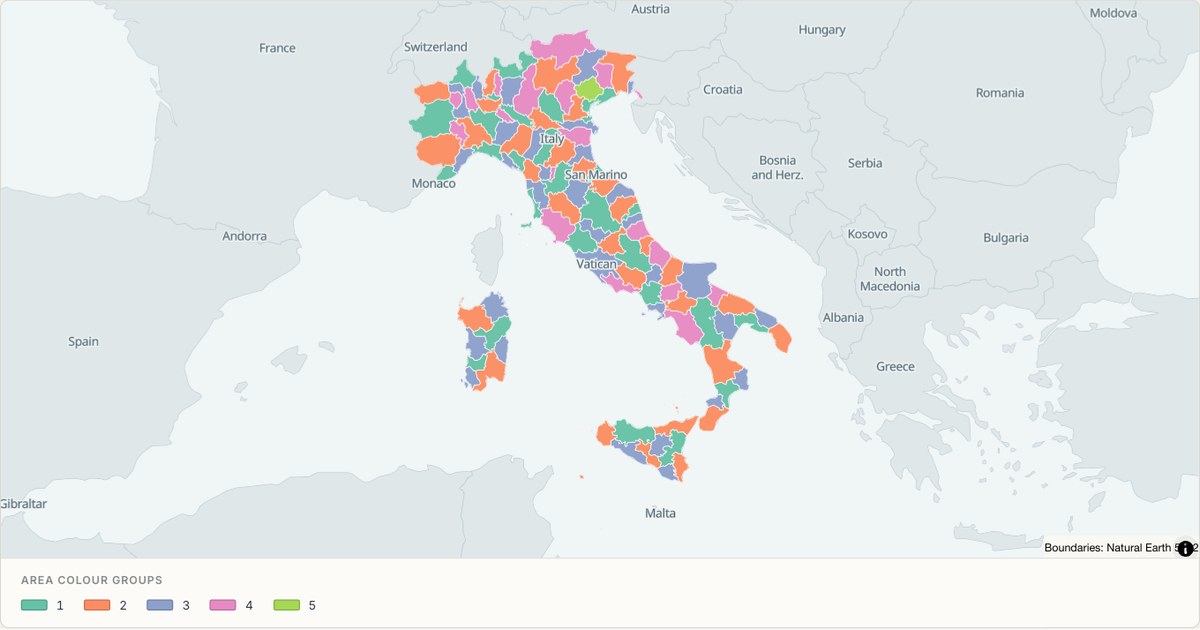 TopoJSONCategorical regions
Italy administrative map
Explore 110 named areas in Italy. Each boundary is selectable and carries a stable identifier, so you can add your own values or distinguish neighbouring areas with a categorical colour scheme.
Open map →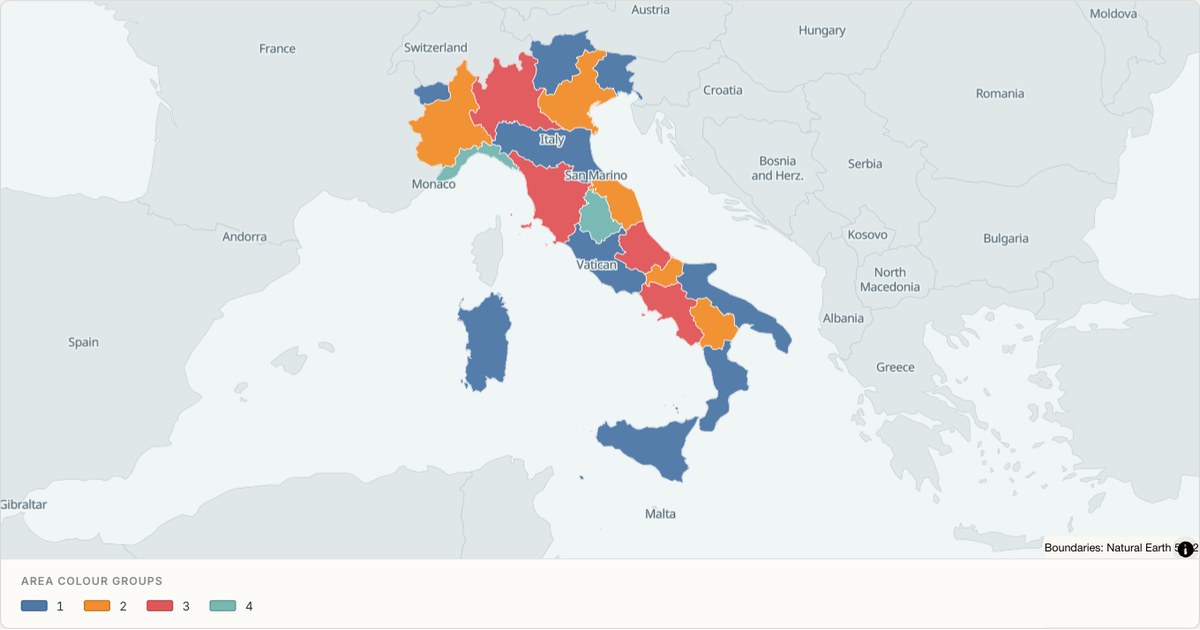 TopoJSONCategorical regions
Italy (regions) administrative map
Explore 20 named areas in Italy (regions). Each boundary is selectable and carries a stable identifier, so you can add your own values or distinguish neighbouring areas with a categorical colour scheme.
Open map →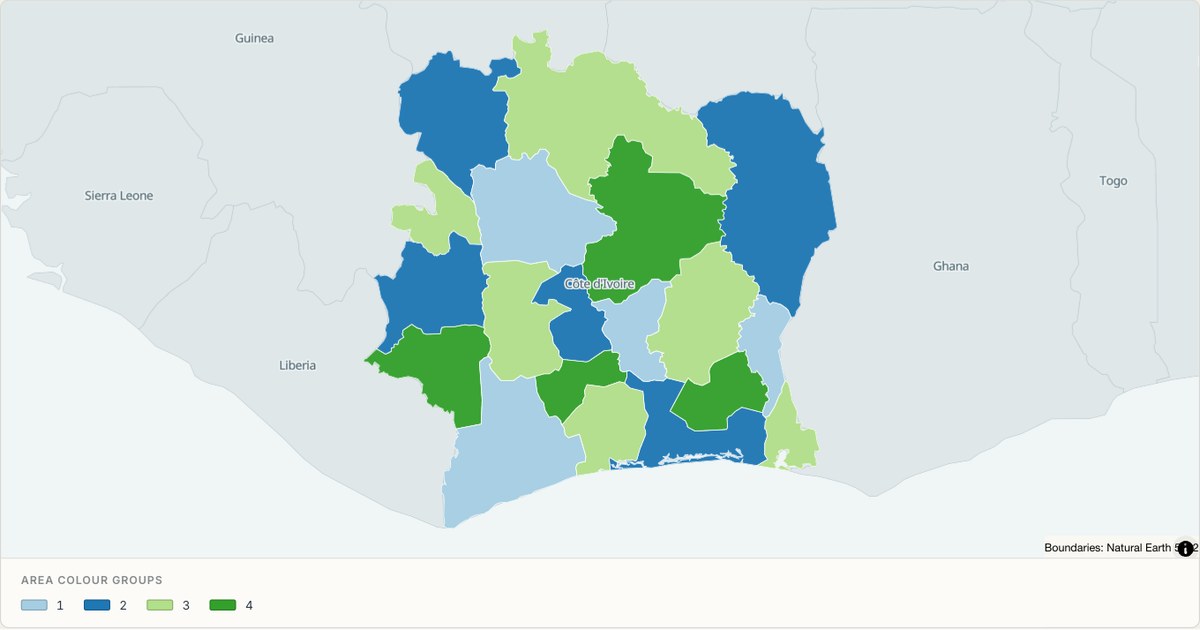 TopoJSONCategorical regions
Ivory Coast administrative map
Explore 19 named areas in Ivory Coast. Each boundary is selectable and carries a stable identifier, so you can add your own values or distinguish neighbouring areas with a categorical colour scheme.
Open map →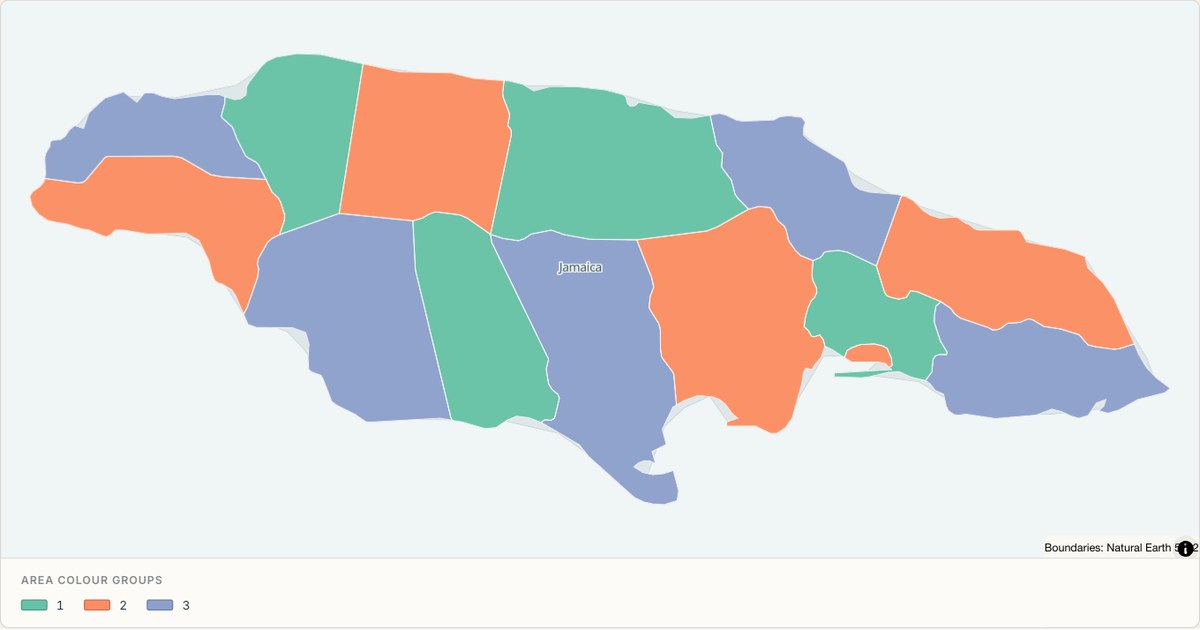 TopoJSONCategorical regions
Jamaica administrative map
Explore 14 named areas in Jamaica. Each boundary is selectable and carries a stable identifier, so you can add your own values or distinguish neighbouring areas with a categorical colour scheme.
Open map →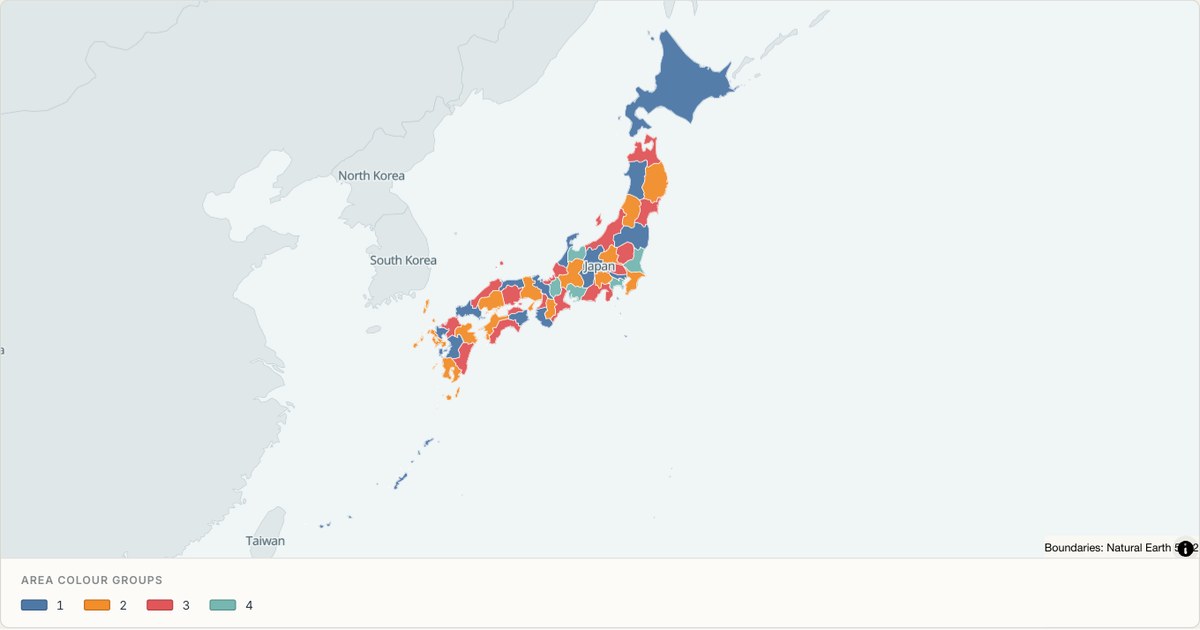 TopoJSONCategorical regions
Japan administrative map
Explore 47 named areas in Japan. Each boundary is selectable and carries a stable identifier, so you can add your own values or distinguish neighbouring areas with a categorical colour scheme.
Open map →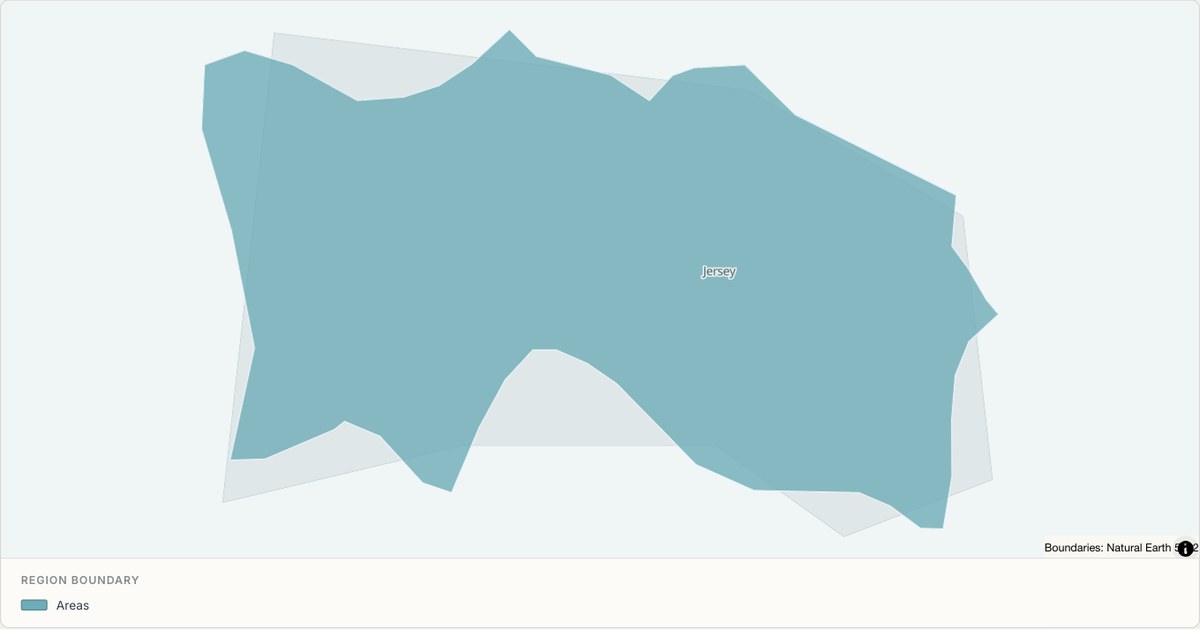 TopoJSONSingle boundary
Jersey boundary map
Explore the boundary supplied for Jersey. This snapshot contains one feature and does not provide internal subdivisions. Inspect its identifier and source attributes, or use it as a starting outline for your own map.
Open map →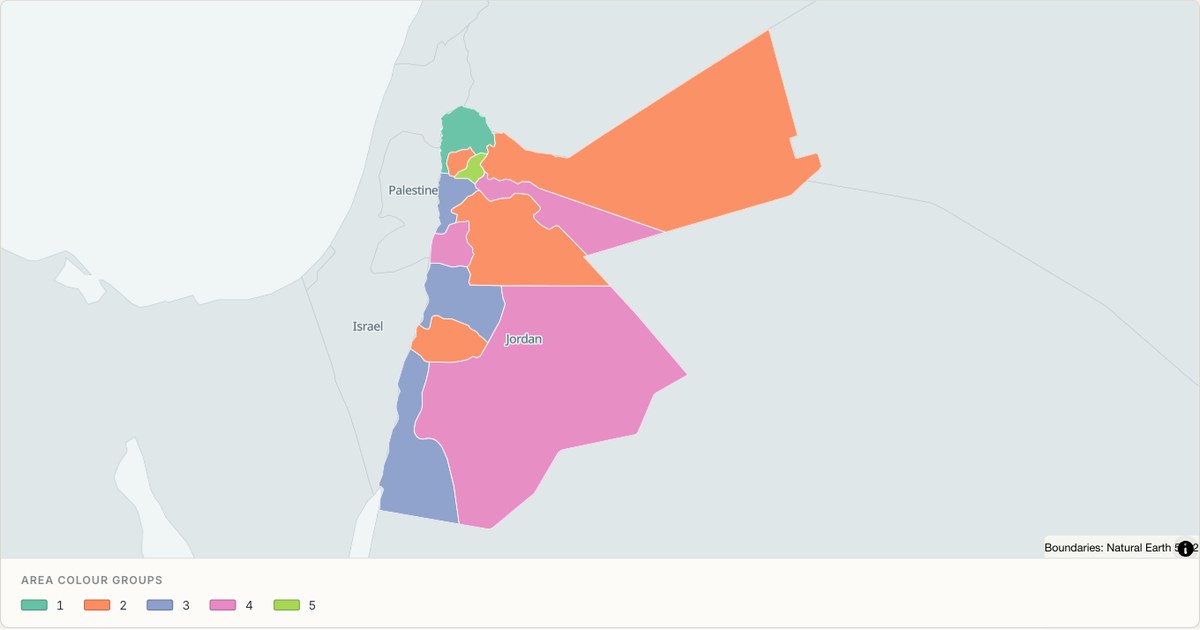 TopoJSONCategorical regions
Jordan administrative map
Explore 12 named areas in Jordan. Each boundary is selectable and carries a stable identifier, so you can add your own values or distinguish neighbouring areas with a categorical colour scheme.
Open map →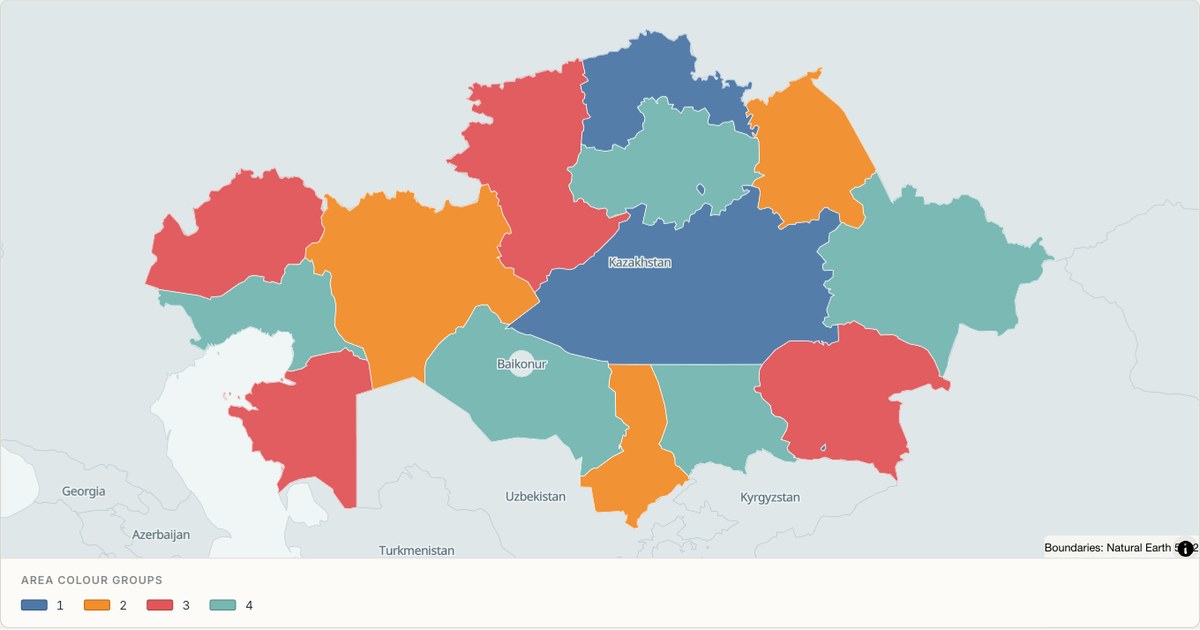 TopoJSONCategorical regions
Kazakhstan administrative map
Explore 16 named areas in Kazakhstan. Each boundary is selectable and carries a stable identifier, so you can add your own values or distinguish neighbouring areas with a categorical colour scheme.
Open map →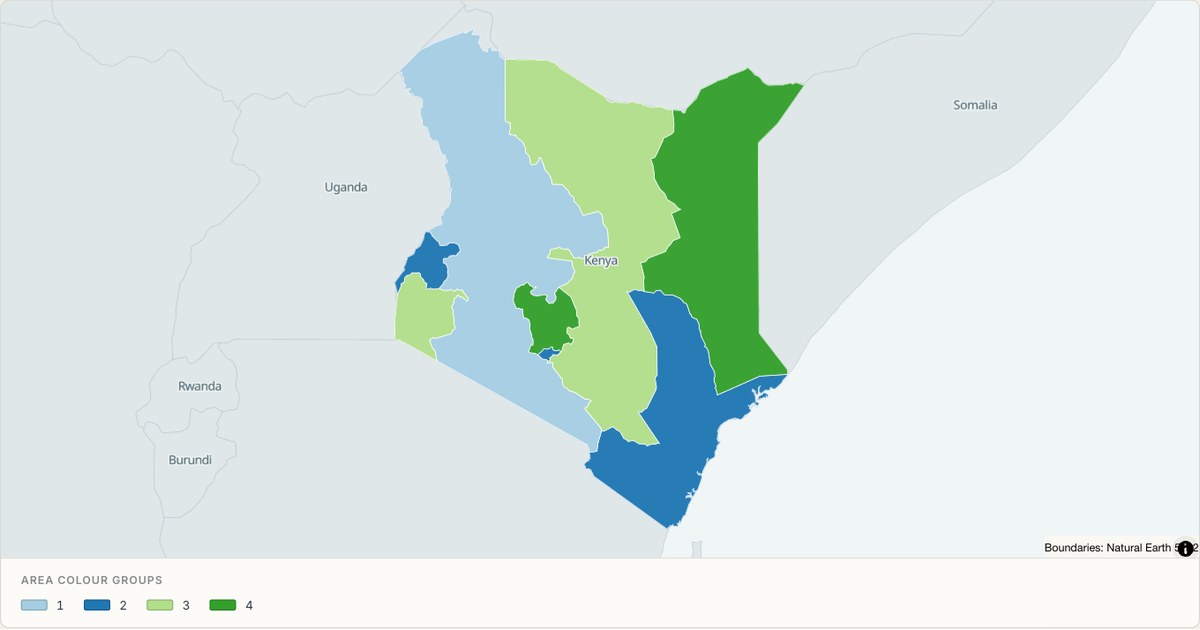 TopoJSONCategorical regions
Kenya administrative map
Explore 8 named areas in Kenya. Each boundary is selectable and carries a stable identifier, so you can add your own values or distinguish neighbouring areas with a categorical colour scheme.
Open map →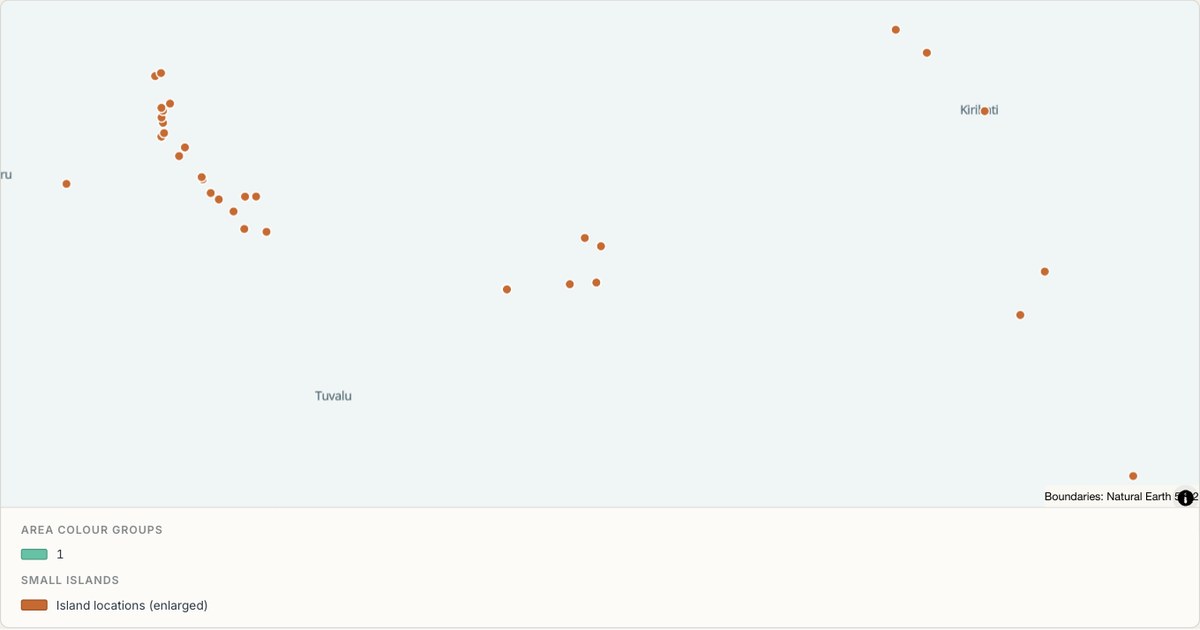 TopoJSONCategorical regions
Kiribati administrative map
Explore 2 named areas in Kiribati. Each boundary is selectable and carries a stable identifier, so you can add your own values or distinguish neighbouring areas with a categorical colour scheme.
Open map →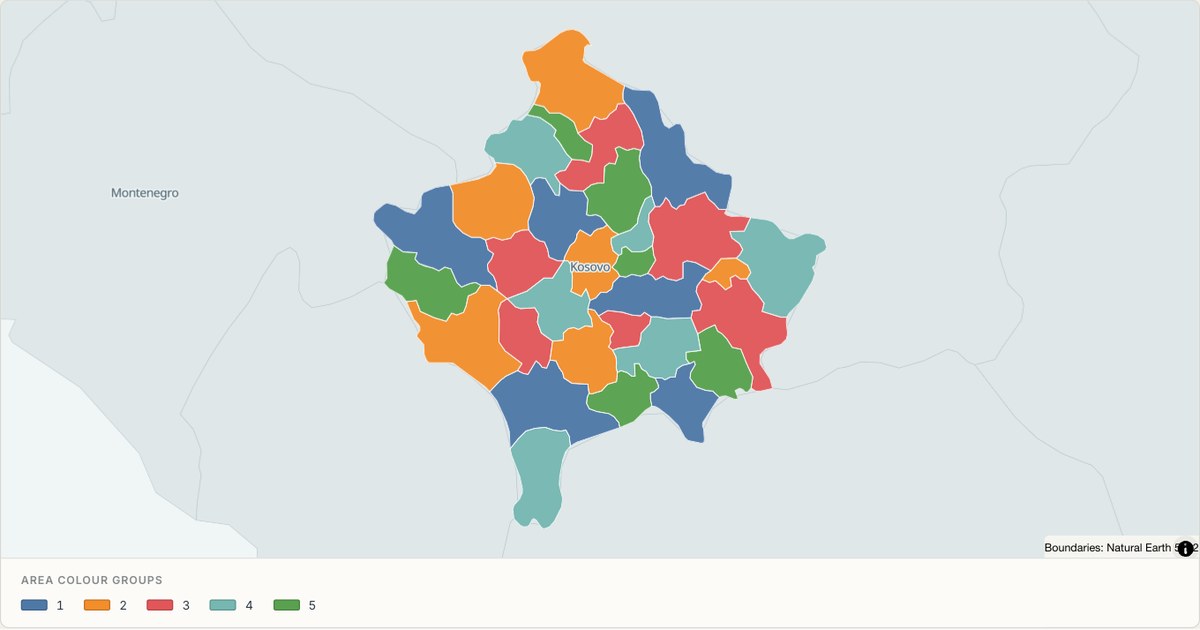 TopoJSONCategorical regions
Kosovo administrative map
Explore 30 named areas in Kosovo. Each boundary is selectable and carries a stable identifier, so you can add your own values or distinguish neighbouring areas with a categorical colour scheme.
Open map →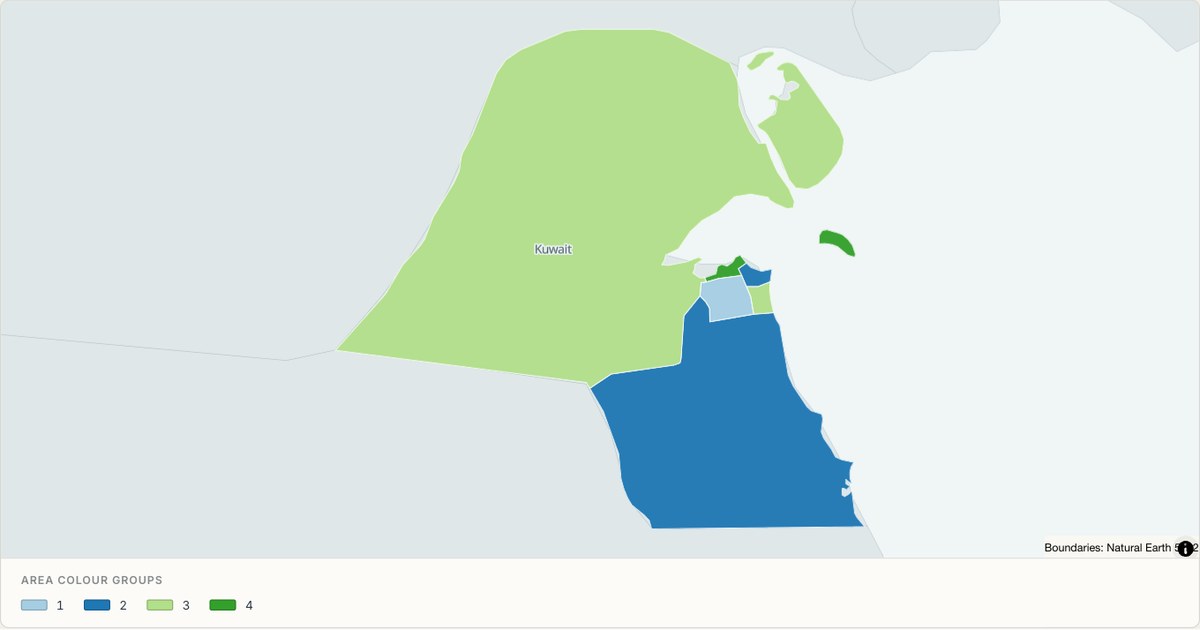 TopoJSONCategorical regions
Kuwait administrative map
Explore 6 named areas in Kuwait. Each boundary is selectable and carries a stable identifier, so you can add your own values or distinguish neighbouring areas with a categorical colour scheme.
Open map →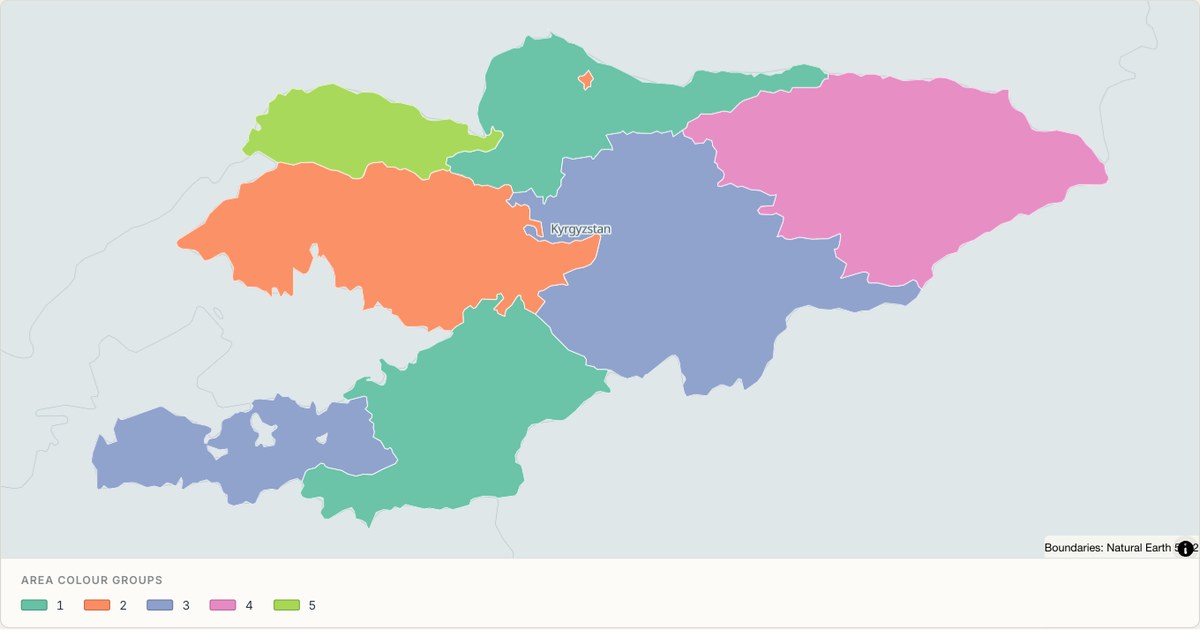 TopoJSONCategorical regions
Kyrgyzstan administrative map
Explore 8 named areas in Kyrgyzstan. Each boundary is selectable and carries a stable identifier, so you can add your own values or distinguish neighbouring areas with a categorical colour scheme.
Open map →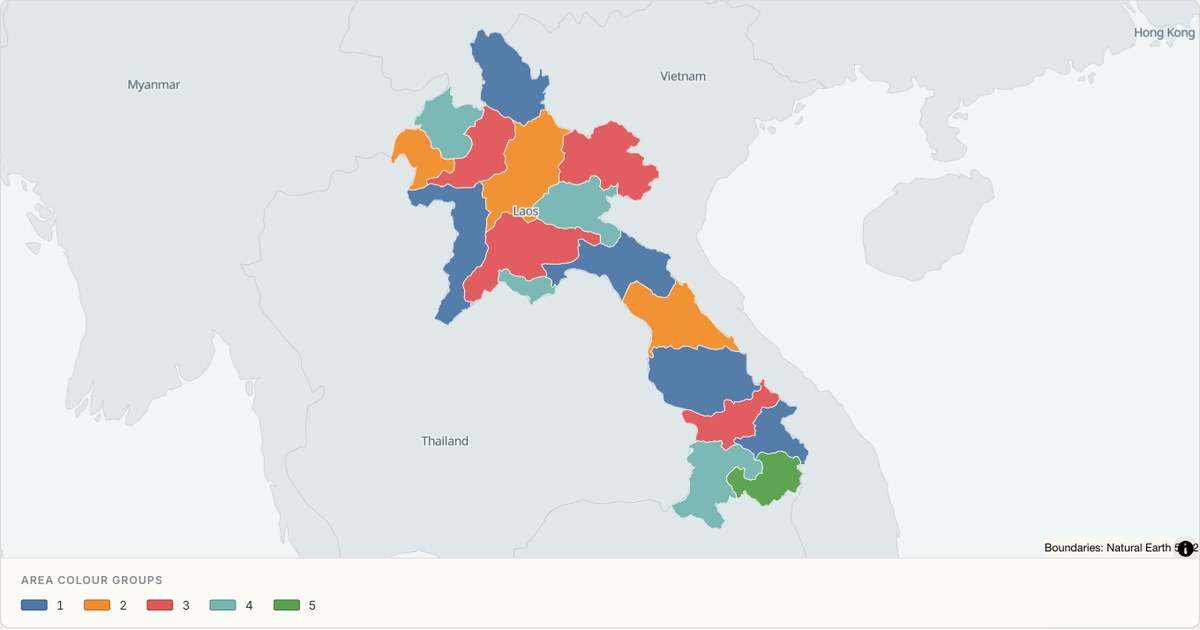 TopoJSONCategorical regions
Laos administrative map
Explore 17 named areas in Laos. Each boundary is selectable and carries a stable identifier, so you can add your own values or distinguish neighbouring areas with a categorical colour scheme.
Open map →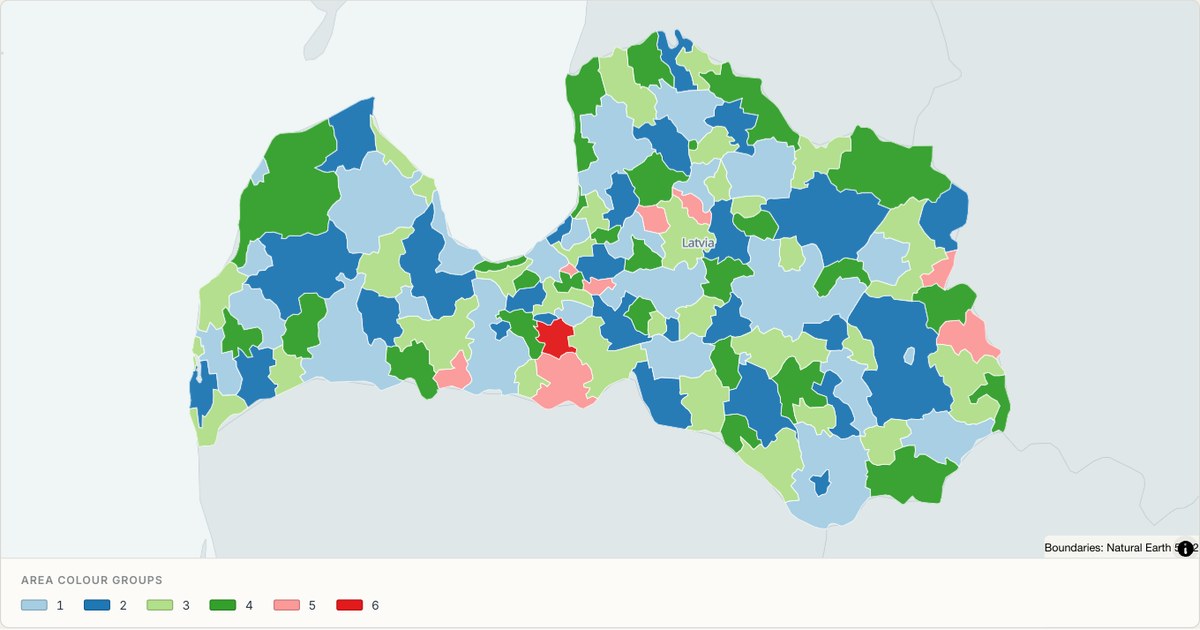 TopoJSONCategorical regions
Latvia administrative map
Explore 119 named areas in Latvia. Each boundary is selectable and carries a stable identifier, so you can add your own values or distinguish neighbouring areas with a categorical colour scheme.
Open map →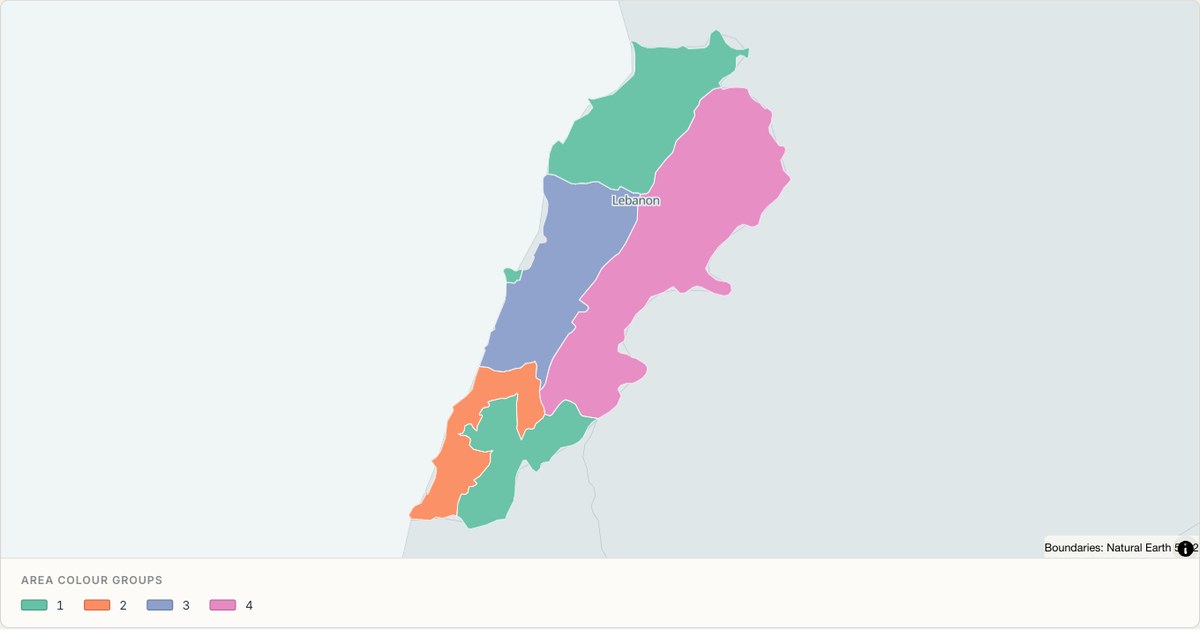 TopoJSONCategorical regions
Lebanon administrative map
Explore 6 named areas in Lebanon. Each boundary is selectable and carries a stable identifier, so you can add your own values or distinguish neighbouring areas with a categorical colour scheme.
Open map →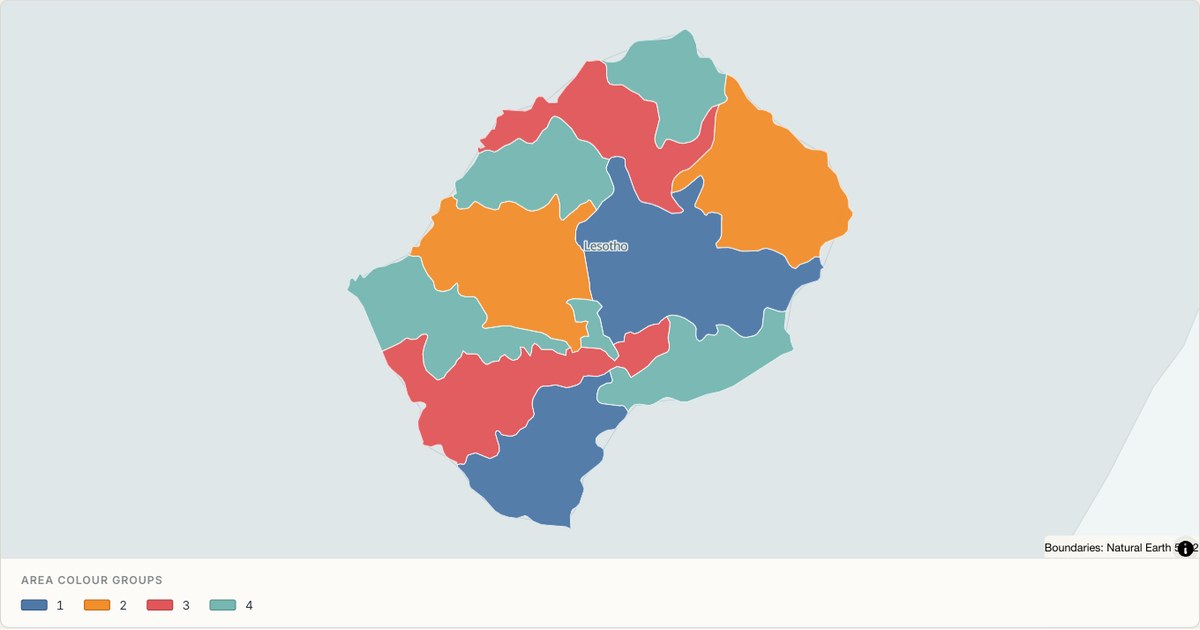 TopoJSONCategorical regions
Lesotho administrative map
Explore 10 named areas in Lesotho. Each boundary is selectable and carries a stable identifier, so you can add your own values or distinguish neighbouring areas with a categorical colour scheme.
Open map →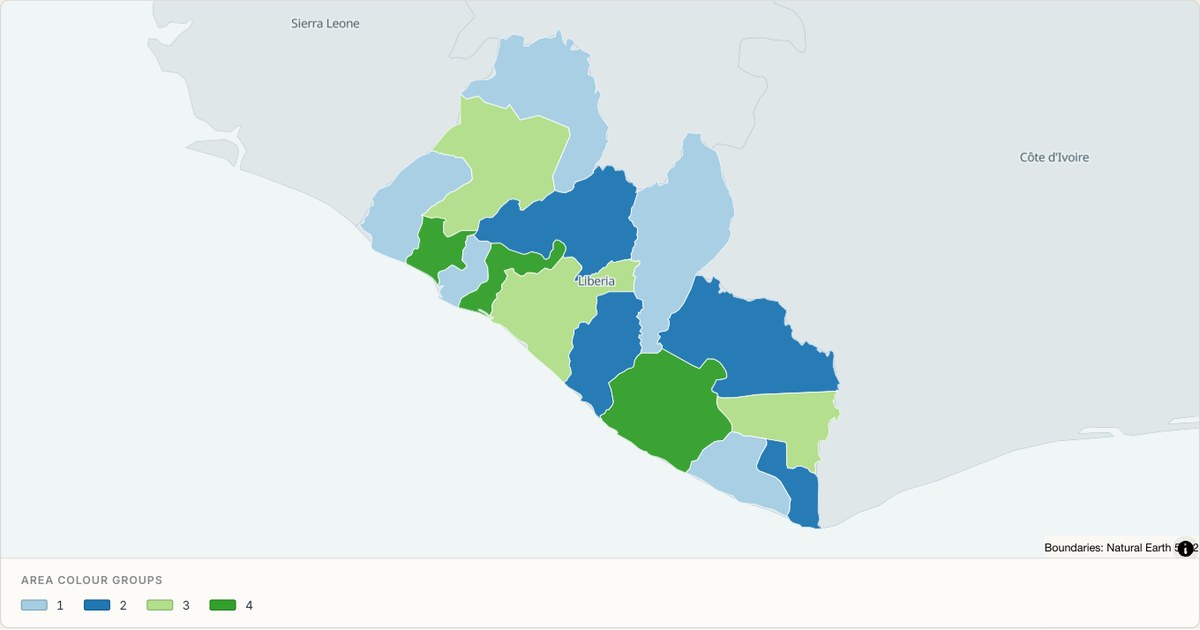 TopoJSONCategorical regions
Liberia administrative map
Explore 15 named areas in Liberia. Each boundary is selectable and carries a stable identifier, so you can add your own values or distinguish neighbouring areas with a categorical colour scheme.
Open map →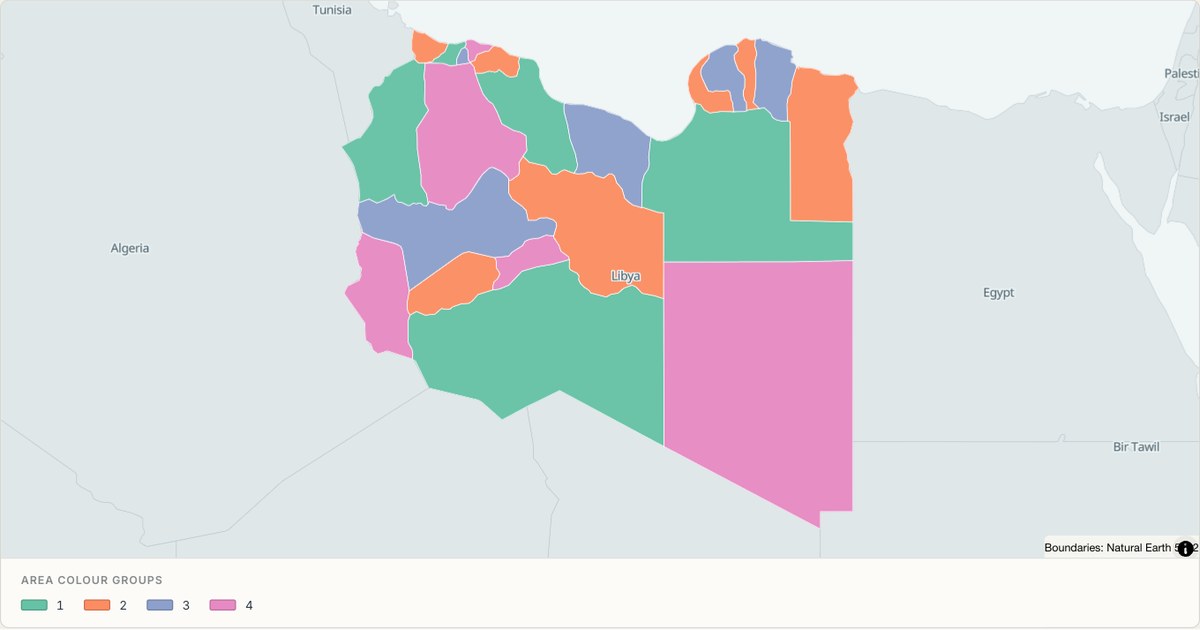 TopoJSONCategorical regions
Libya administrative map
Explore 22 named areas in Libya. Each boundary is selectable and carries a stable identifier, so you can add your own values or distinguish neighbouring areas with a categorical colour scheme.
Open map →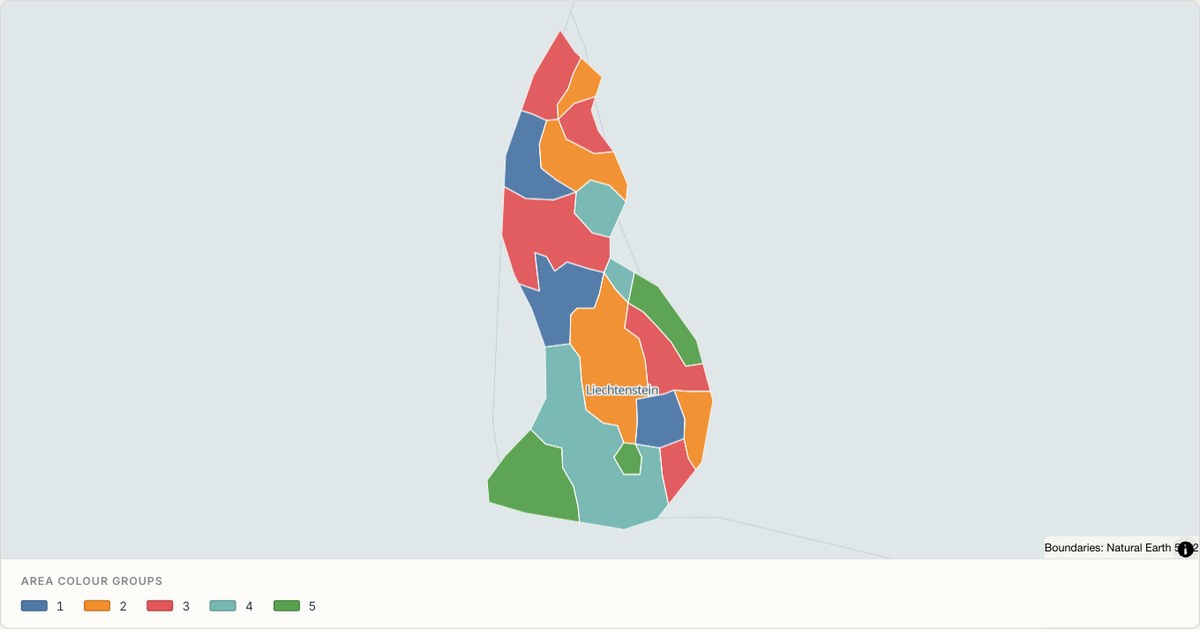 TopoJSONCategorical regions
Liechtenstein administrative map
Explore 11 named areas in Liechtenstein. Each boundary is selectable and carries a stable identifier, so you can add your own values or distinguish neighbouring areas with a categorical colour scheme.
Open map →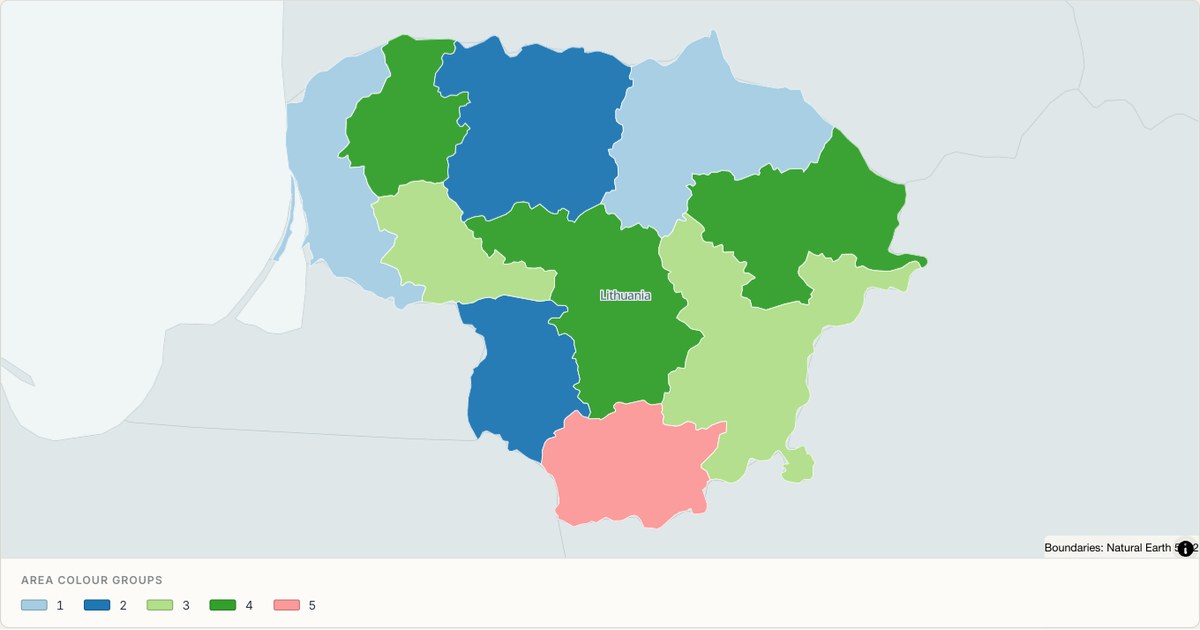 TopoJSONCategorical regions
Lithuania administrative map
Explore 10 named areas in Lithuania. Each boundary is selectable and carries a stable identifier, so you can add your own values or distinguish neighbouring areas with a categorical colour scheme.
Open map →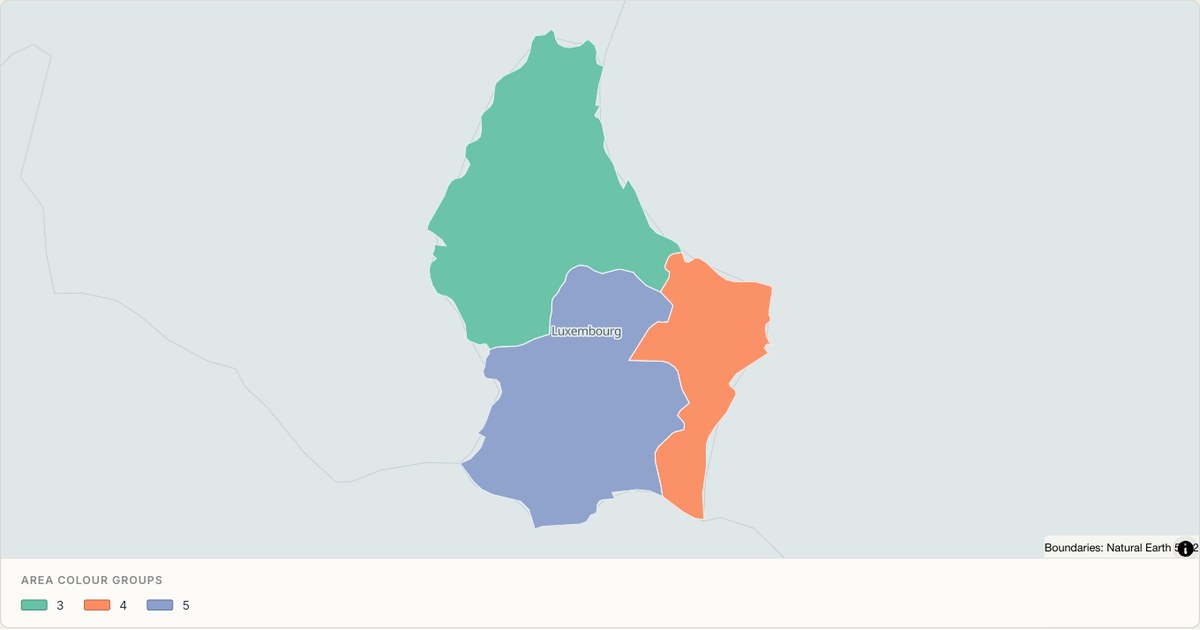 TopoJSONCategorical regions
Luxembourg administrative map
Explore 3 named areas in Luxembourg. Each boundary is selectable and carries a stable identifier, so you can add your own values or distinguish neighbouring areas with a categorical colour scheme.
Open map →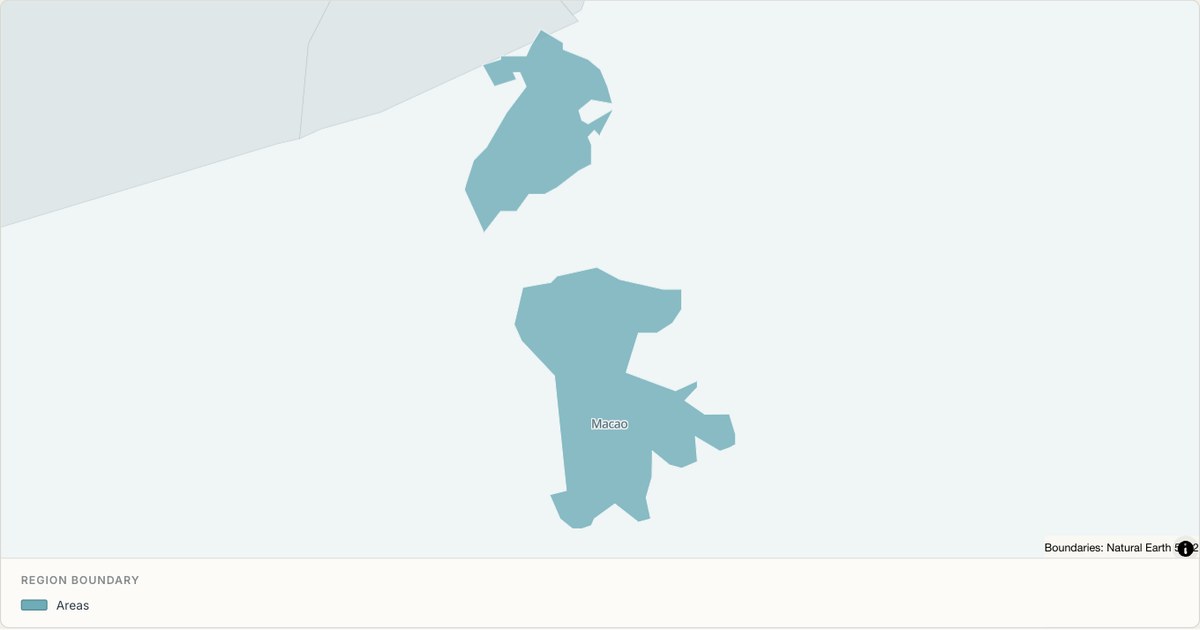 TopoJSONSingle boundary
Macau S.A.R boundary map
Explore the boundary supplied for Macau S.A.R. This snapshot contains one feature and does not provide internal subdivisions. Inspect its identifier and source attributes, or use it as a starting outline for your own map.
Open map →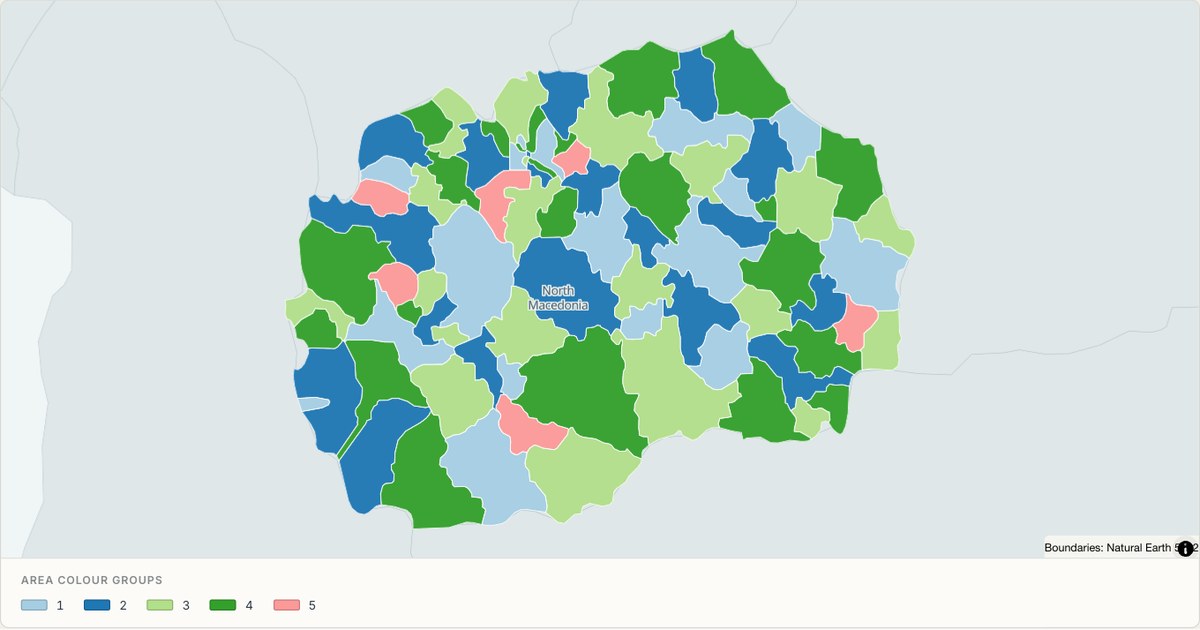 TopoJSONCategorical regions
Macedonia administrative map
Explore 84 named areas in Macedonia. Each boundary is selectable and carries a stable identifier, so you can add your own values or distinguish neighbouring areas with a categorical colour scheme.
Open map →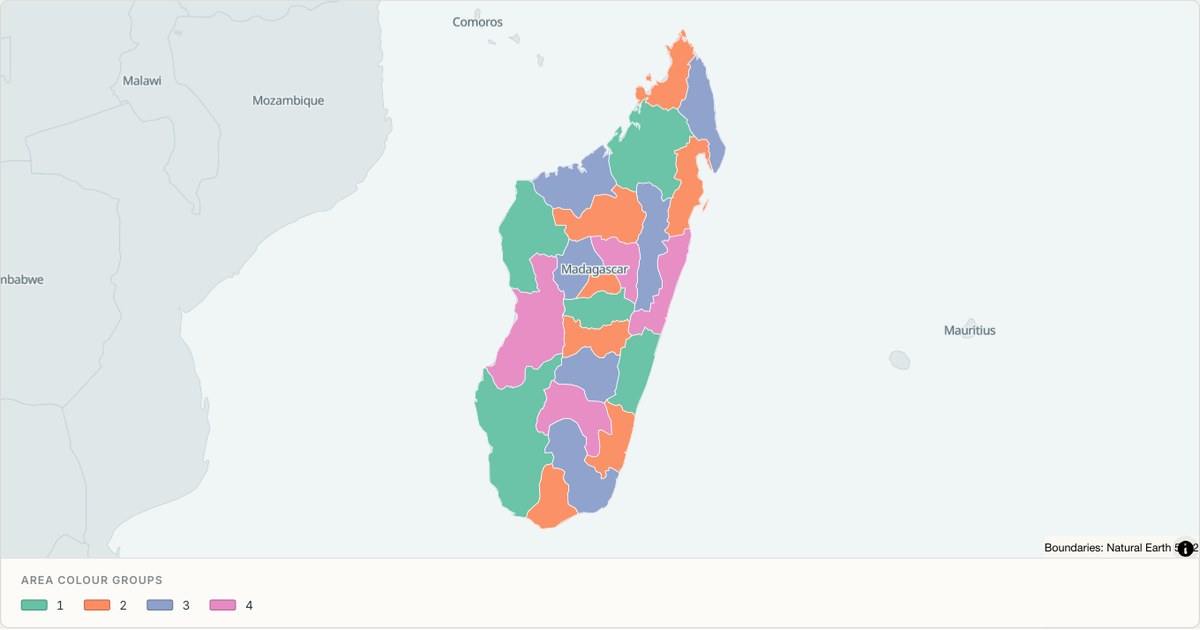 TopoJSONCategorical regions
Madagascar administrative map
Explore 22 named areas in Madagascar. Each boundary is selectable and carries a stable identifier, so you can add your own values or distinguish neighbouring areas with a categorical colour scheme.
Open map →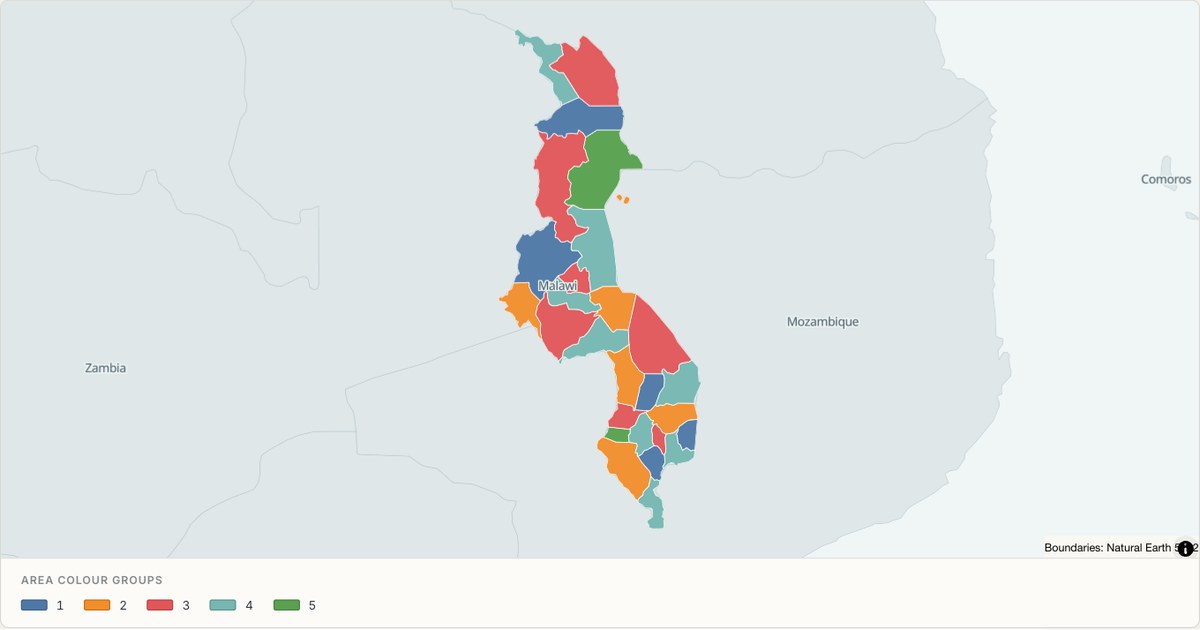 TopoJSONCategorical regions
Malawi administrative map
Explore 28 named areas in Malawi. Each boundary is selectable and carries a stable identifier, so you can add your own values or distinguish neighbouring areas with a categorical colour scheme.
Open map →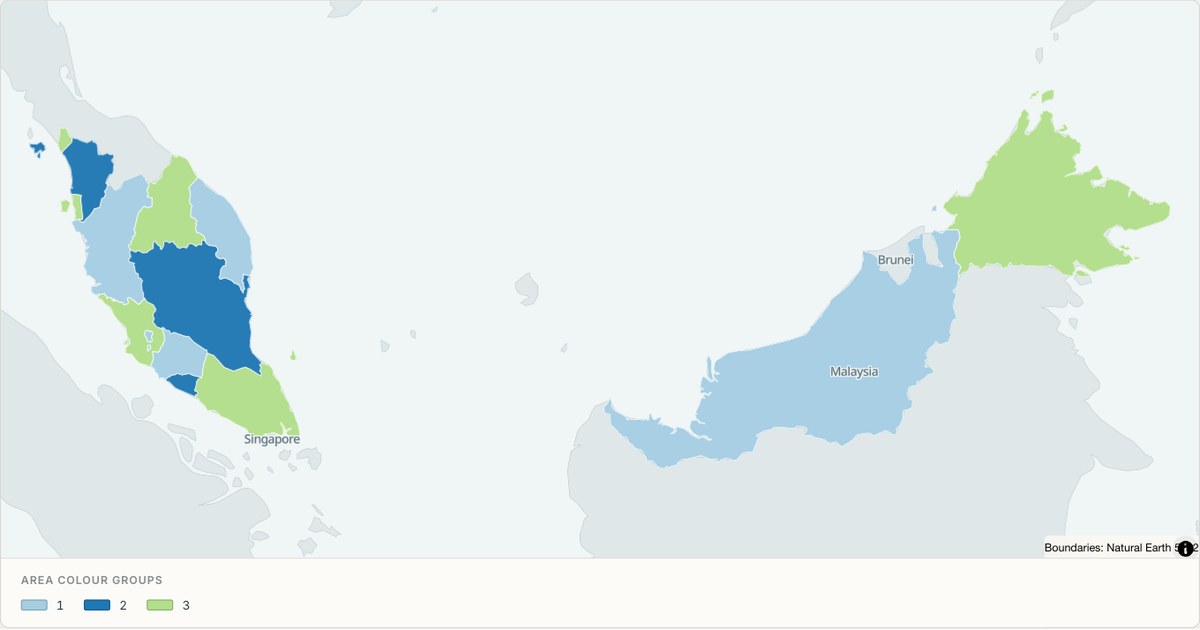 TopoJSONCategorical regions
Malaysia administrative map
Explore 16 named areas in Malaysia. Each boundary is selectable and carries a stable identifier, so you can add your own values or distinguish neighbouring areas with a categorical colour scheme.
Open map →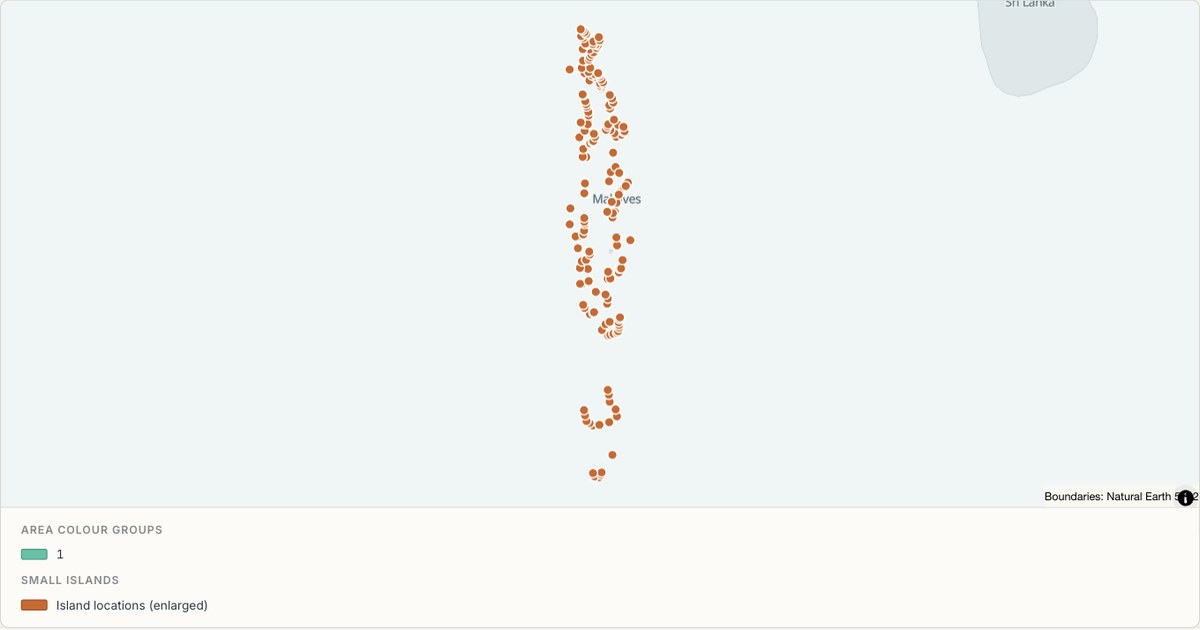 TopoJSONCategorical regions
Maldives administrative map
Explore 21 named areas in Maldives. Each boundary is selectable and carries a stable identifier, so you can add your own values or distinguish neighbouring areas with a categorical colour scheme.
Open map →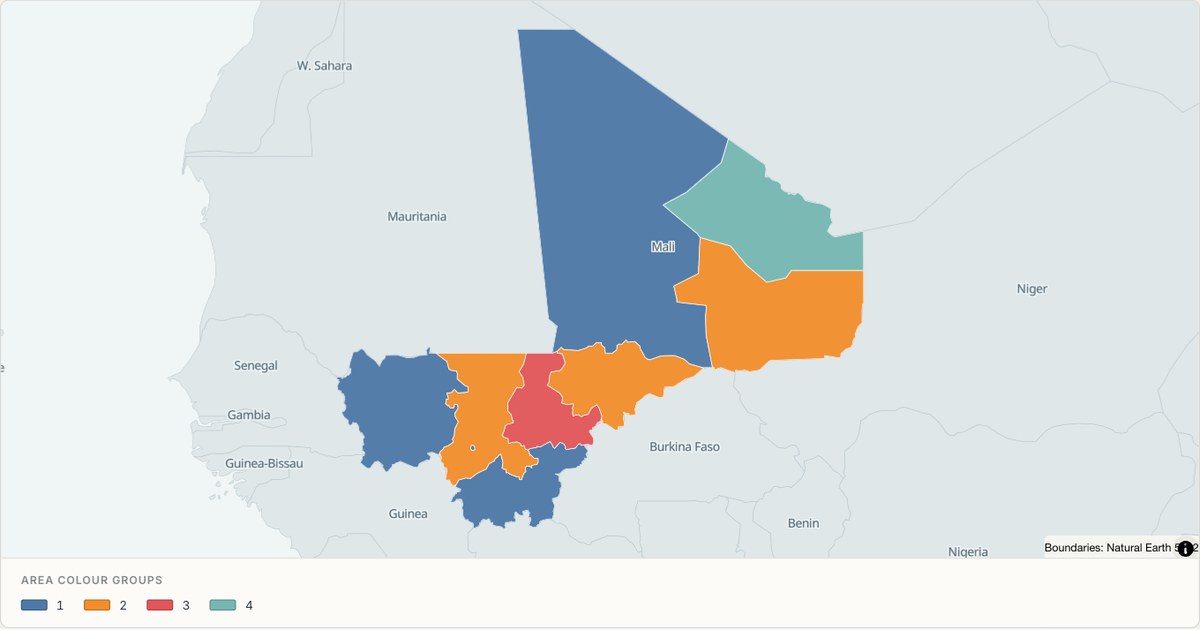 TopoJSONCategorical regions
Mali administrative map
Explore 9 named areas in Mali. Each boundary is selectable and carries a stable identifier, so you can add your own values or distinguish neighbouring areas with a categorical colour scheme.
Open map →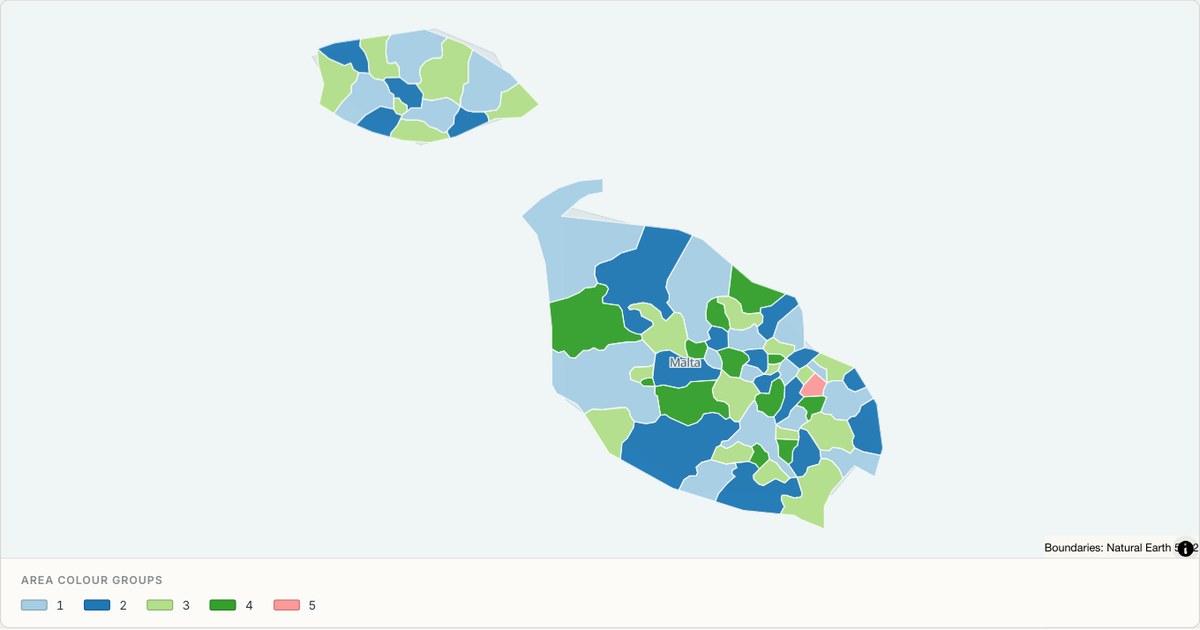 TopoJSONCategorical regions
Malta administrative map
Explore 68 named areas in Malta. Each boundary is selectable and carries a stable identifier, so you can add your own values or distinguish neighbouring areas with a categorical colour scheme.
Open map →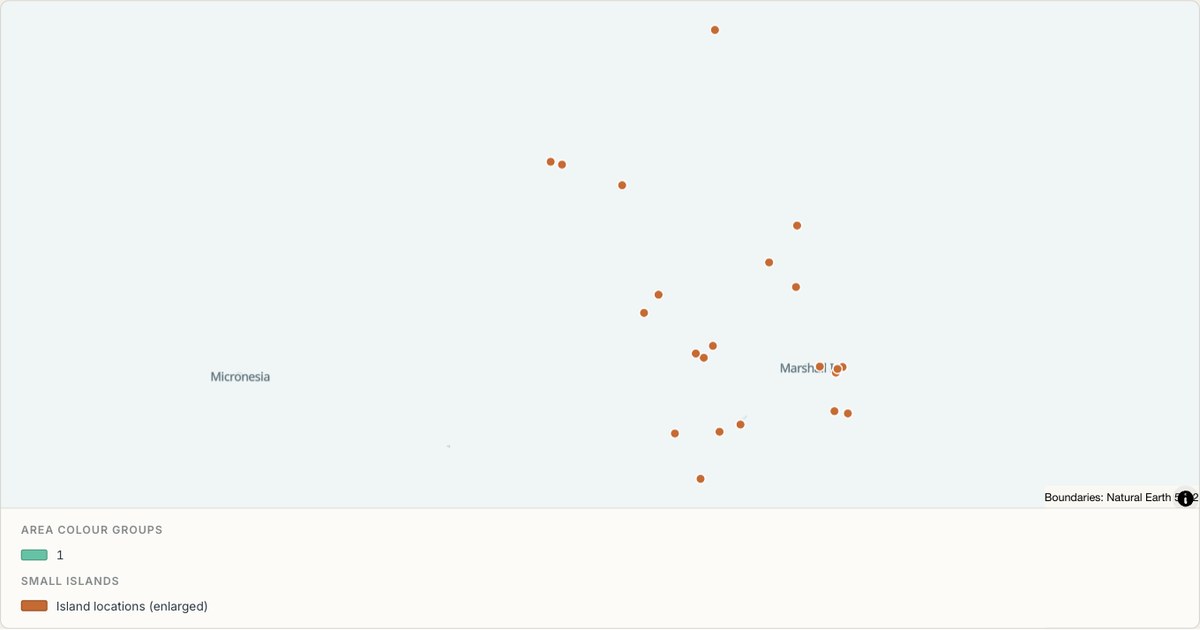 TopoJSONCategorical regions
Marshall Islands administrative map
Explore 2 named areas in Marshall Islands. Each boundary is selectable and carries a stable identifier, so you can add your own values or distinguish neighbouring areas with a categorical colour scheme.
Open map →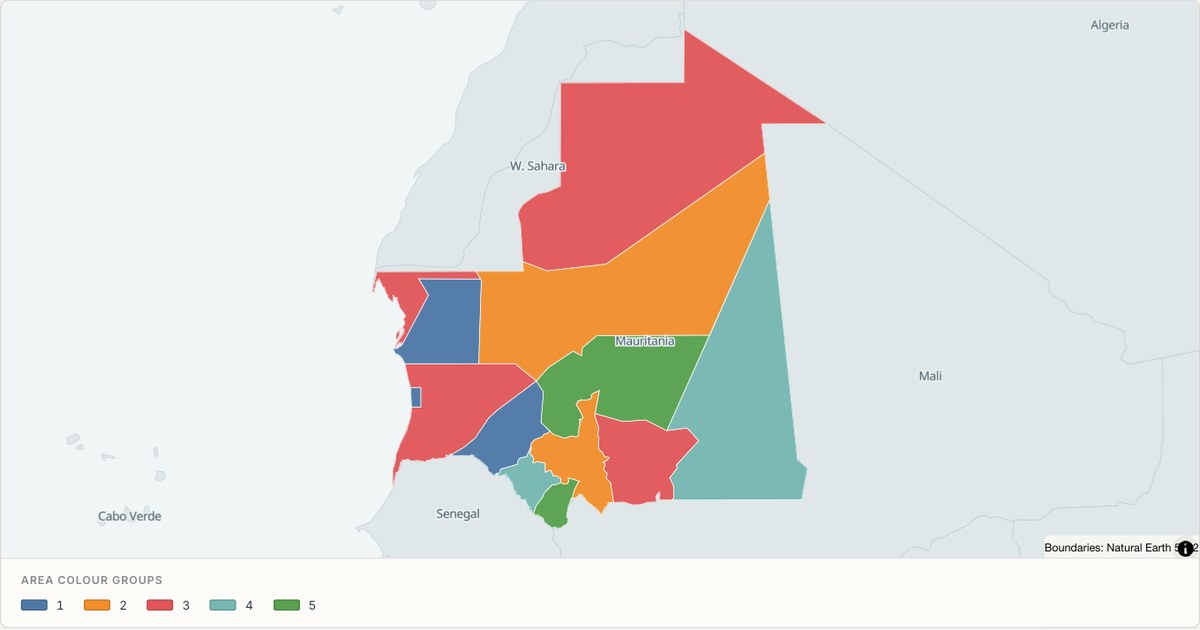 TopoJSONCategorical regions
Mauritania administrative map
Explore 13 named areas in Mauritania. Each boundary is selectable and carries a stable identifier, so you can add your own values or distinguish neighbouring areas with a categorical colour scheme.
Open map → TopoJSONCategorical regions
Mauritius administrative map
Explore 16 named areas in Mauritius. Each boundary is selectable and carries a stable identifier, so you can add your own values or distinguish neighbouring areas with a categorical colour scheme.
Open map →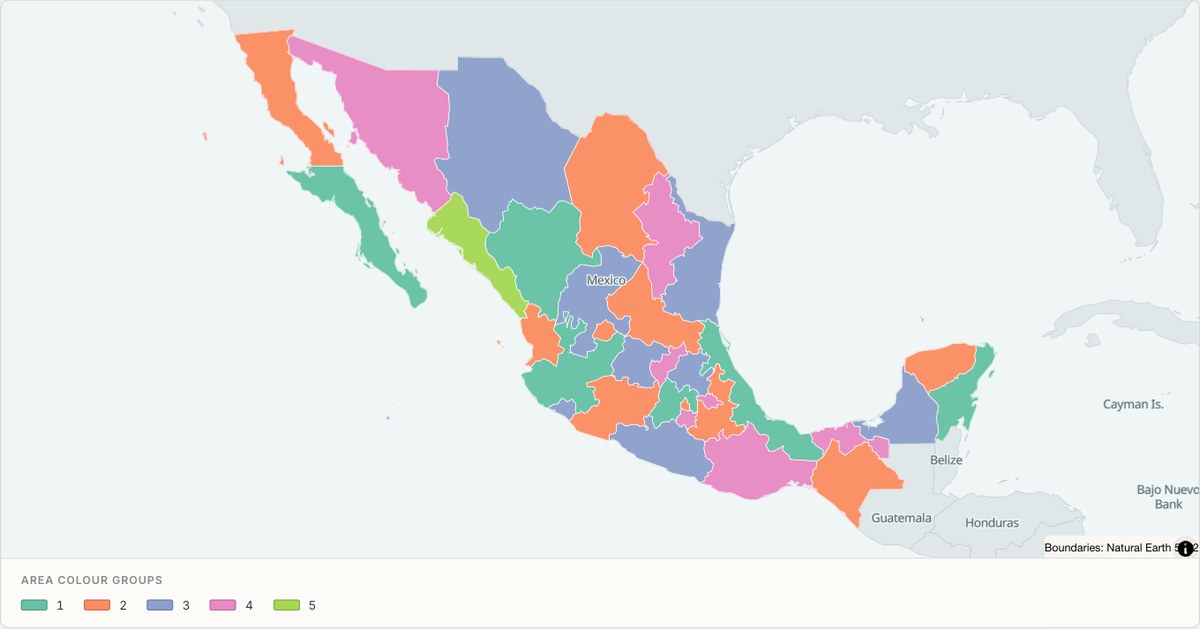 TopoJSONCategorical regions
Mexico administrative map
Explore 33 named areas in Mexico. Each boundary is selectable and carries a stable identifier, so you can add your own values or distinguish neighbouring areas with a categorical colour scheme.
Open map →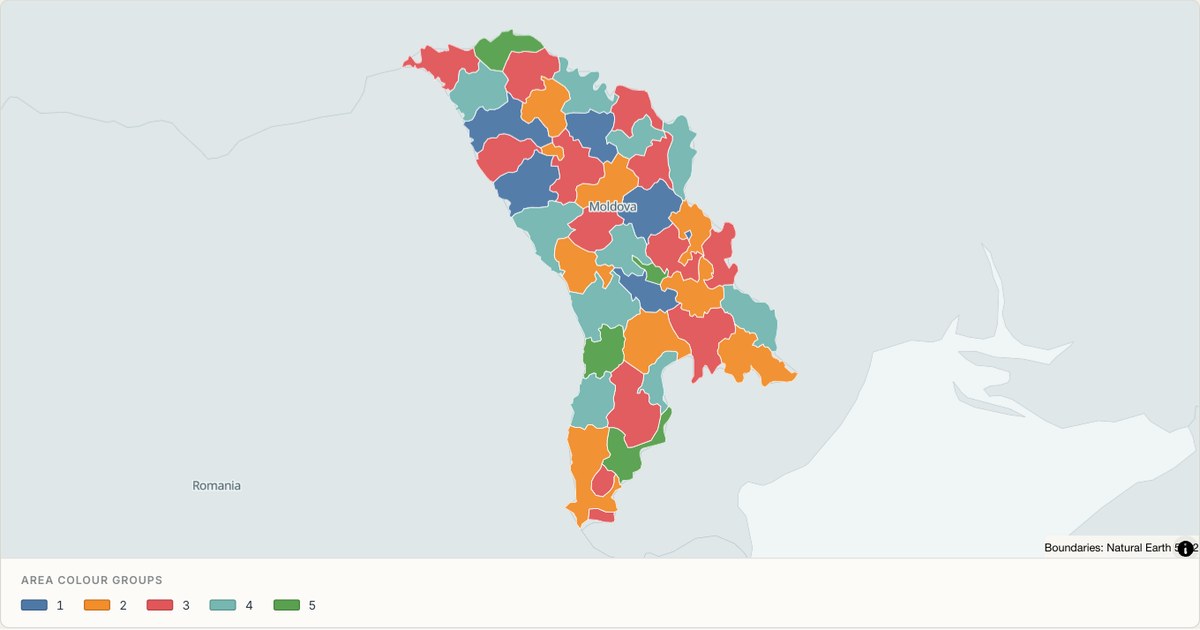 TopoJSONCategorical regions
Moldova administrative map
Explore 40 named areas in Moldova. Each boundary is selectable and carries a stable identifier, so you can add your own values or distinguish neighbouring areas with a categorical colour scheme.
Open map →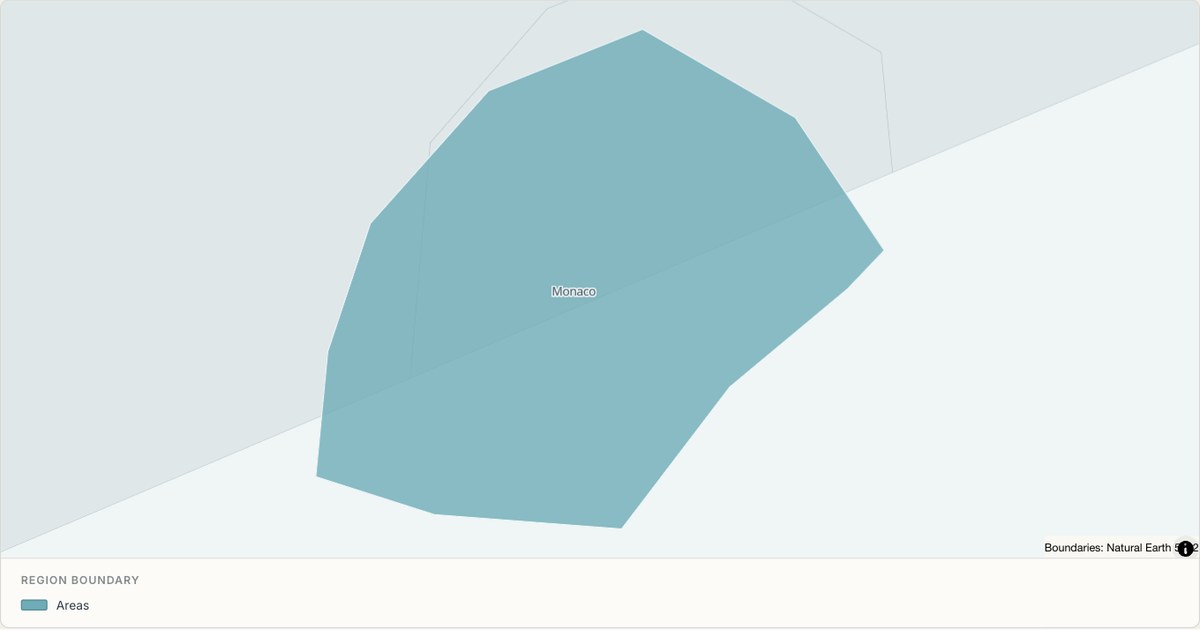 TopoJSONSingle boundary
Monaco boundary map
Explore the boundary supplied for Monaco. This snapshot contains one feature and does not provide internal subdivisions. Inspect its identifier and source attributes, or use it as a starting outline for your own map.
Open map →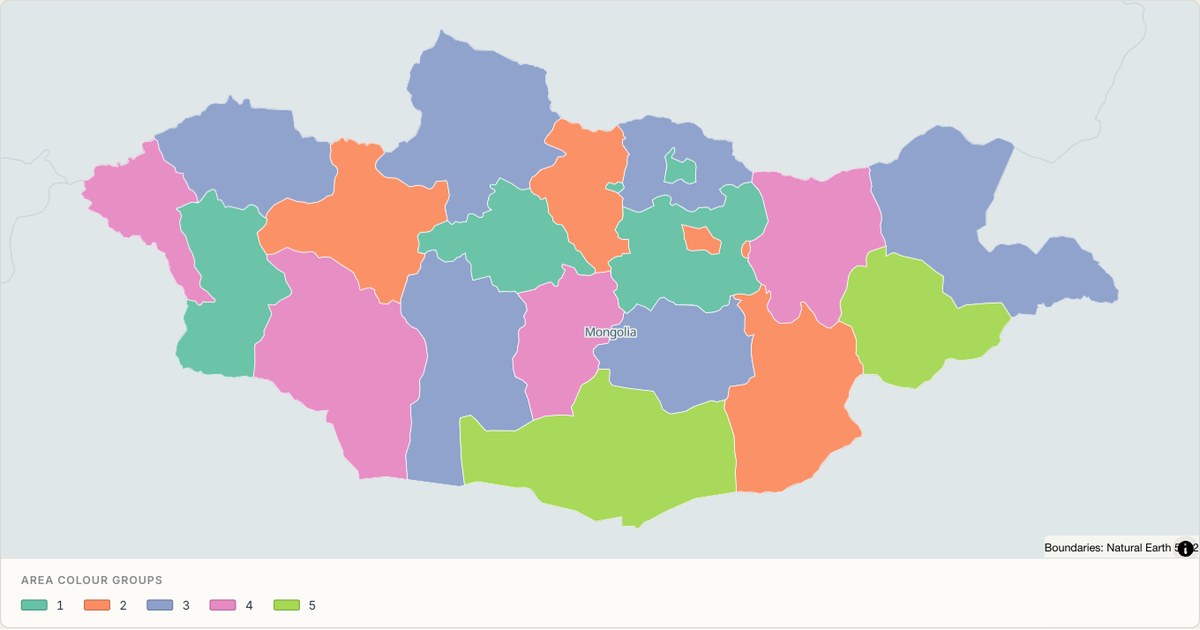 TopoJSONCategorical regions
Mongolia administrative map
Explore 22 named areas in Mongolia. Each boundary is selectable and carries a stable identifier, so you can add your own values or distinguish neighbouring areas with a categorical colour scheme.
Open map →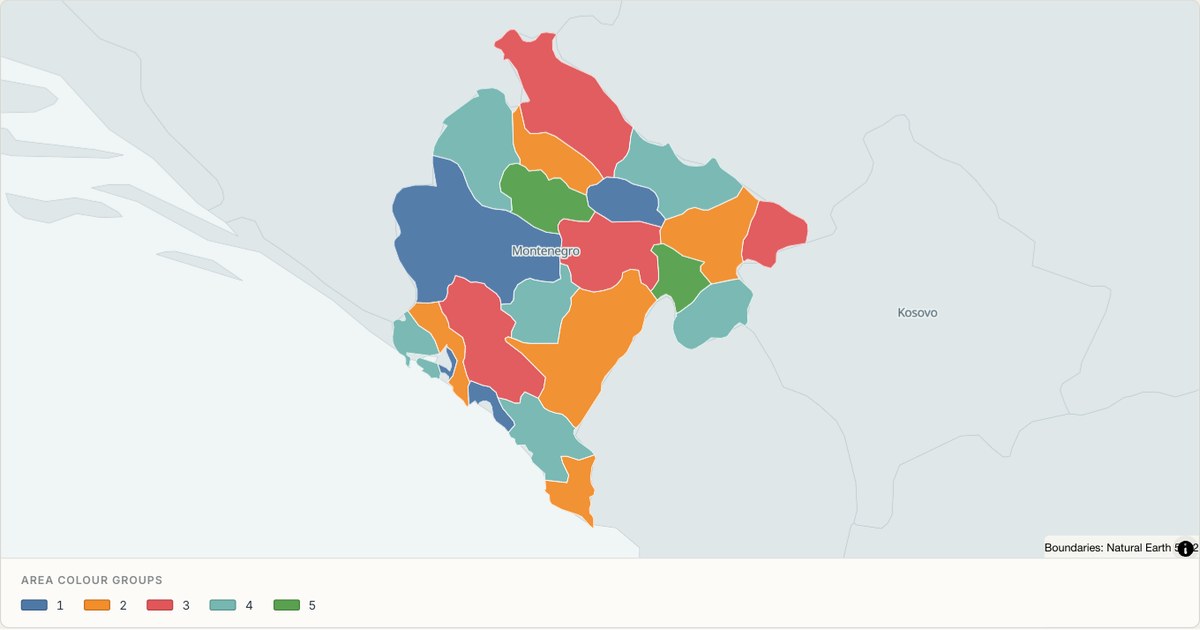 TopoJSONCategorical regions
Montenegro administrative map
Explore 21 named areas in Montenegro. Each boundary is selectable and carries a stable identifier, so you can add your own values or distinguish neighbouring areas with a categorical colour scheme.
Open map →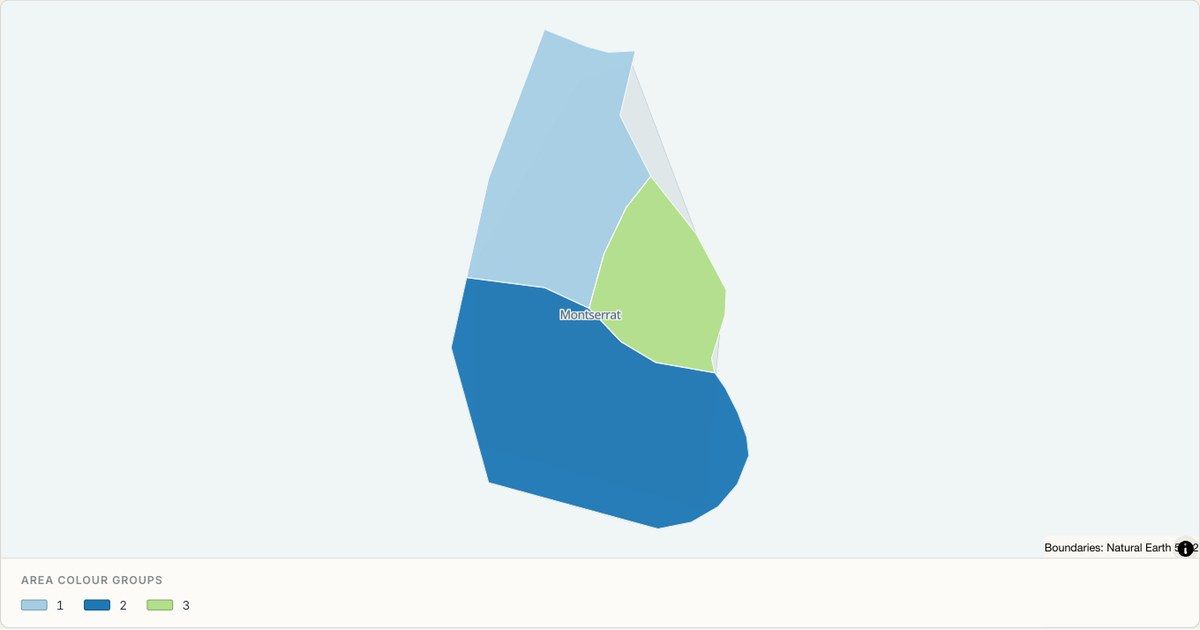 TopoJSONCategorical regions
Montserrat administrative map
Explore 3 named areas in Montserrat. Each boundary is selectable and carries a stable identifier, so you can add your own values or distinguish neighbouring areas with a categorical colour scheme.
Open map →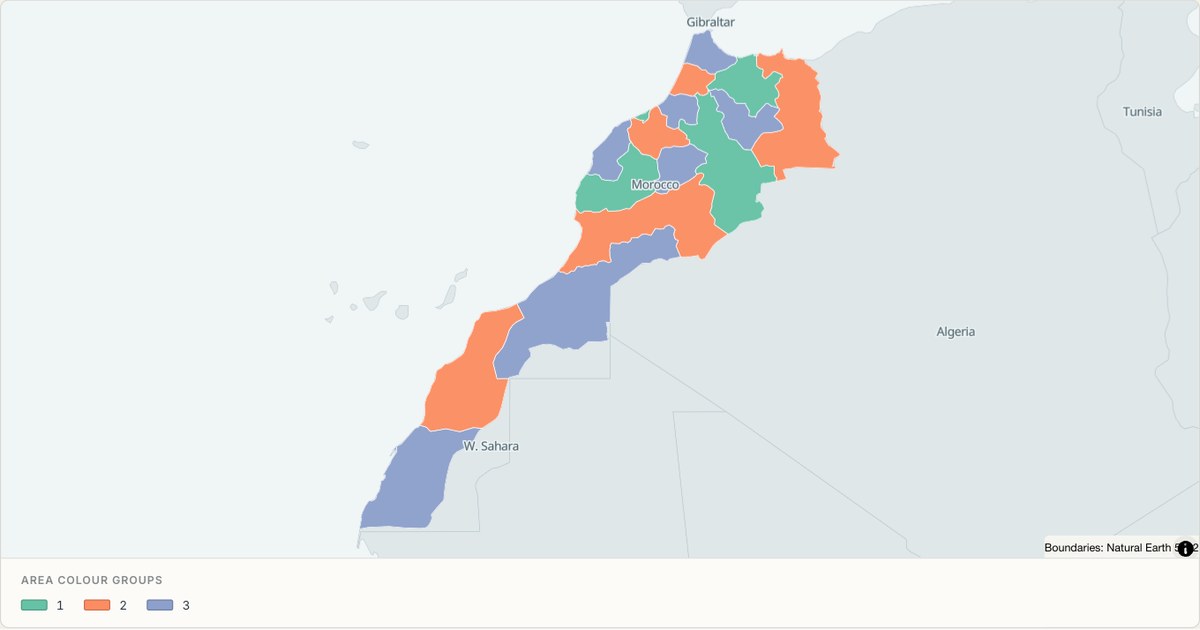 TopoJSONCategorical regions
Morocco administrative map
Explore 16 named areas in Morocco. Each boundary is selectable and carries a stable identifier, so you can add your own values or distinguish neighbouring areas with a categorical colour scheme.
Open map →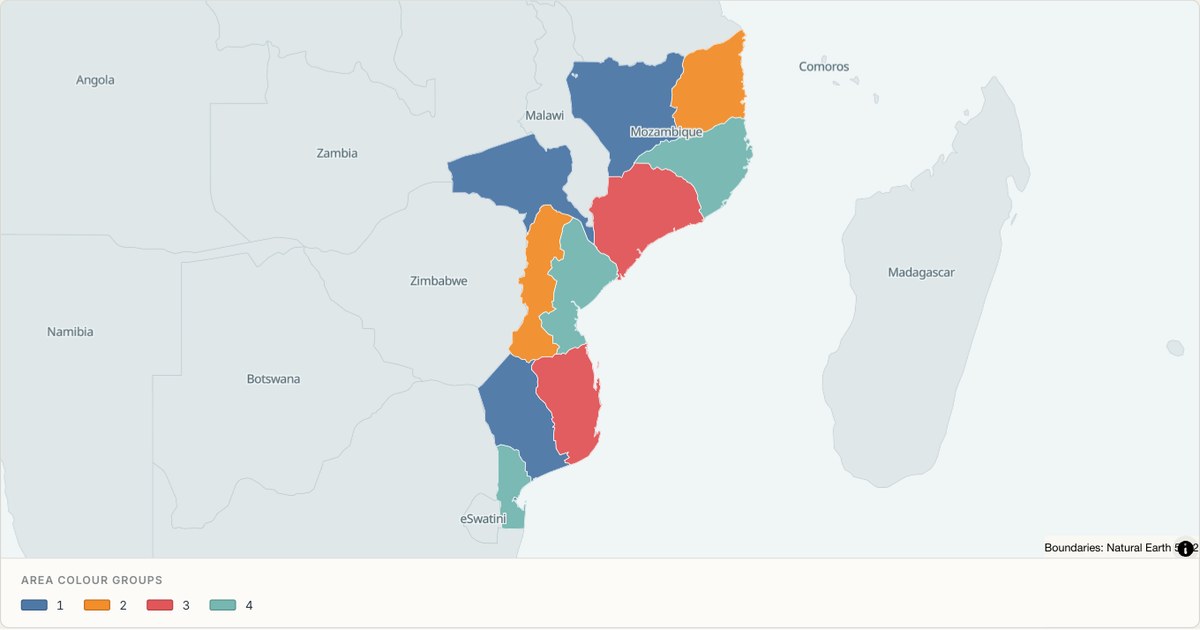 TopoJSONCategorical regions
Mozambique administrative map
Explore 11 named areas in Mozambique. Each boundary is selectable and carries a stable identifier, so you can add your own values or distinguish neighbouring areas with a categorical colour scheme.
Open map →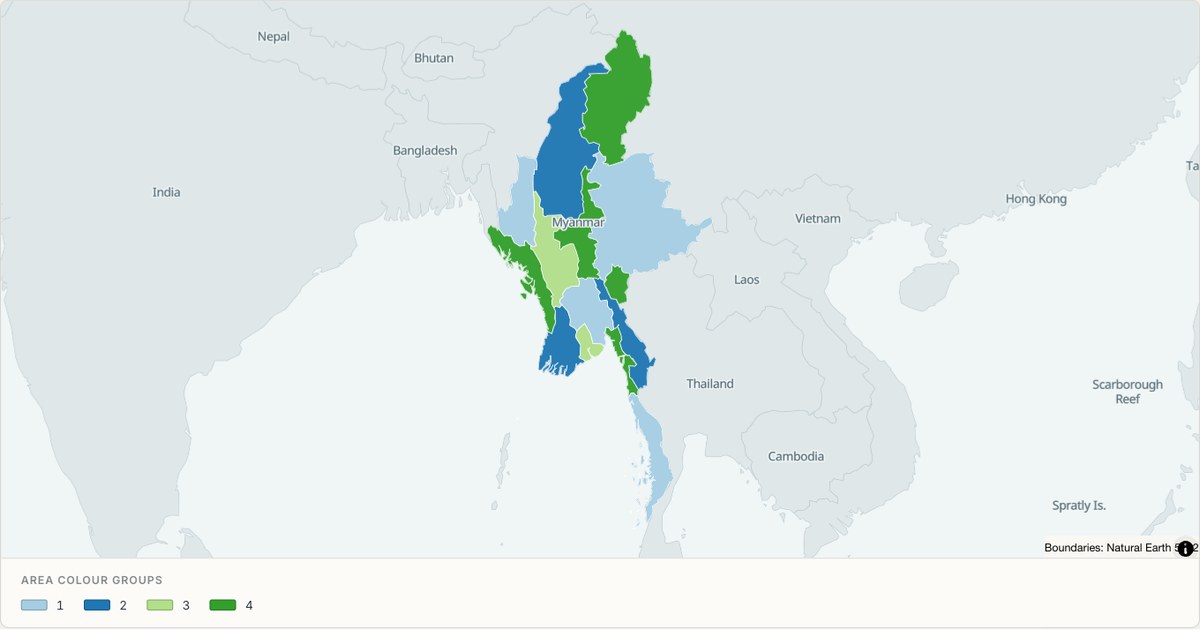 TopoJSONCategorical regions
Myanmar administrative map
Explore 14 named areas in Myanmar. Each boundary is selectable and carries a stable identifier, so you can add your own values or distinguish neighbouring areas with a categorical colour scheme.
Open map →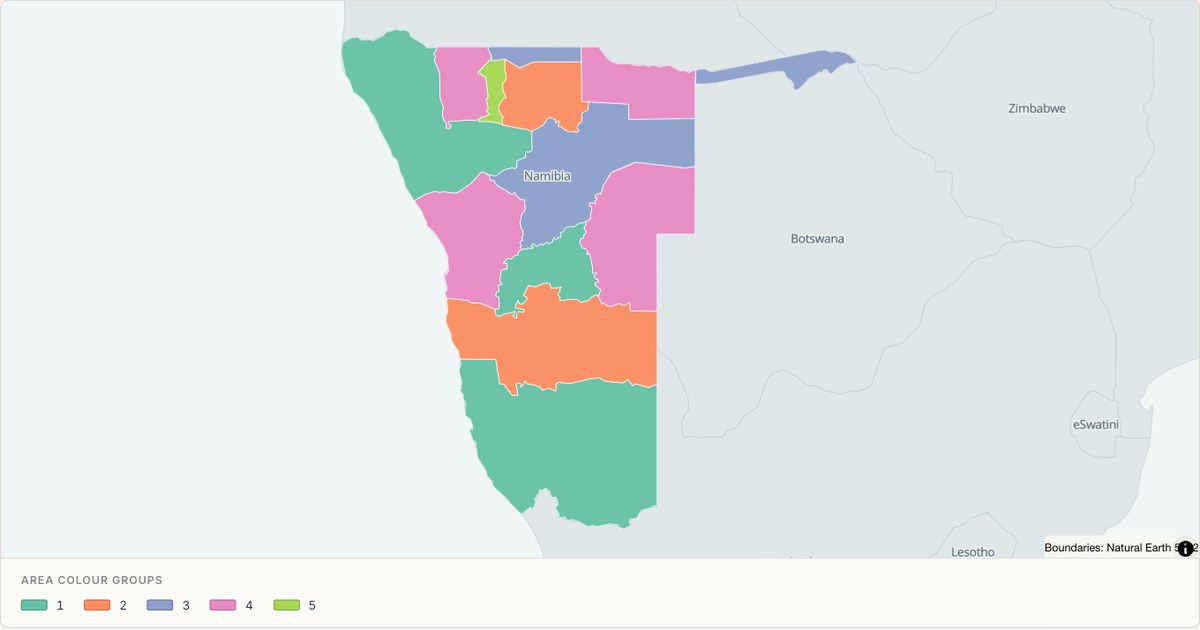 TopoJSONCategorical regions
Namibia administrative map
Explore 13 named areas in Namibia. Each boundary is selectable and carries a stable identifier, so you can add your own values or distinguish neighbouring areas with a categorical colour scheme.
Open map →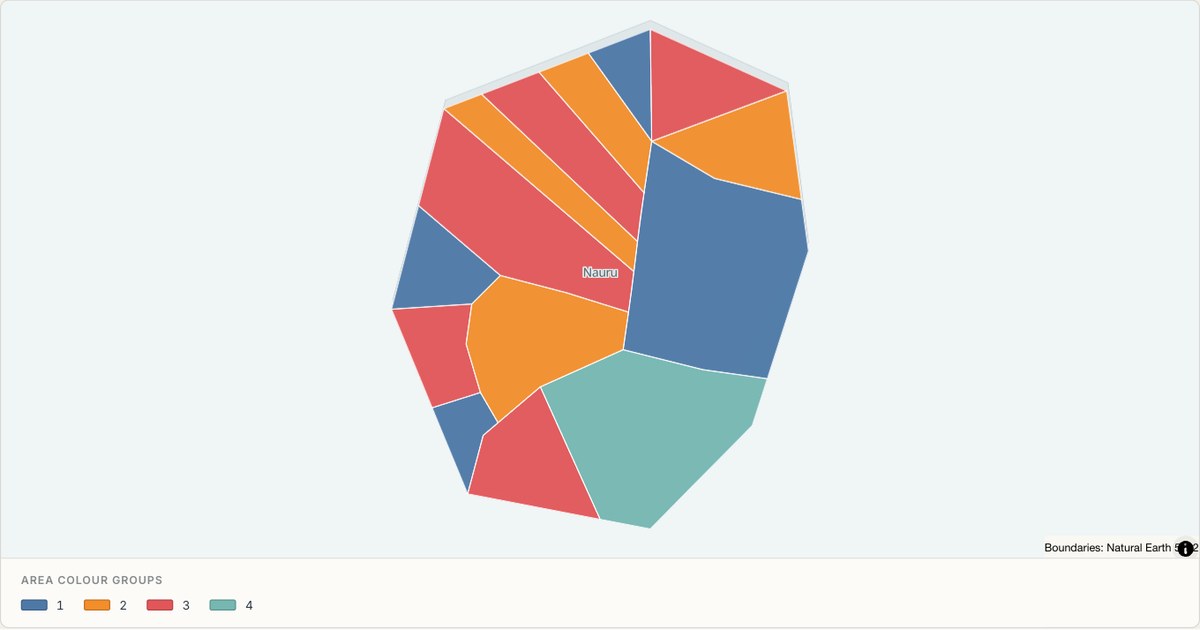 TopoJSONCategorical regions
Nauru administrative map
Explore 14 named areas in Nauru. Each boundary is selectable and carries a stable identifier, so you can add your own values or distinguish neighbouring areas with a categorical colour scheme.
Open map →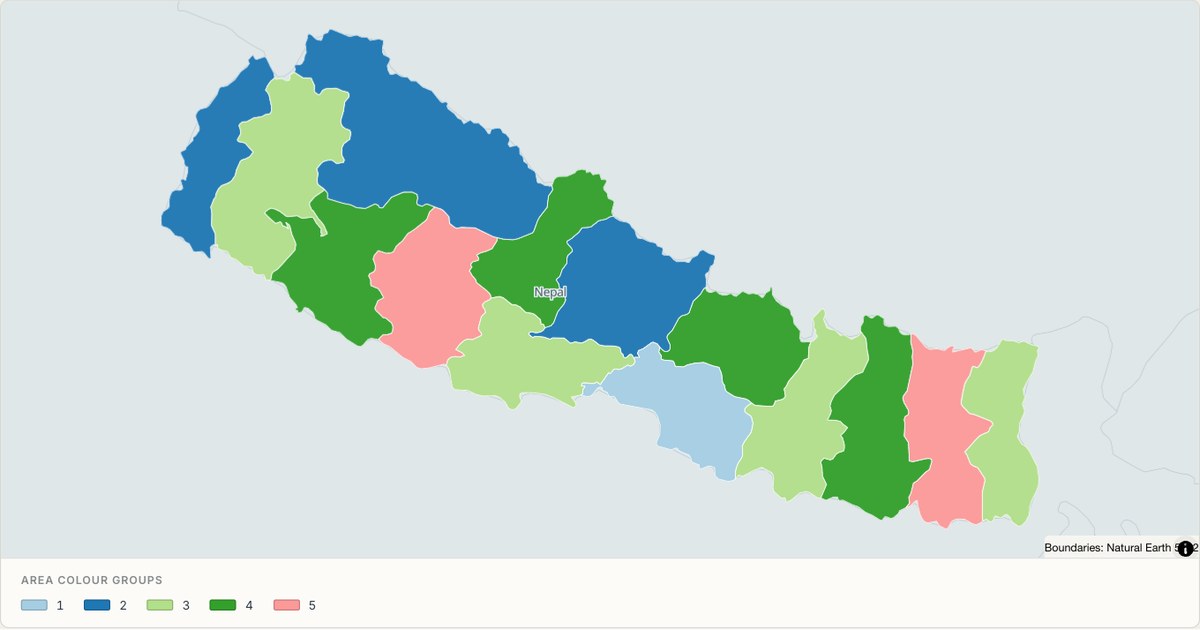 TopoJSONCategorical regions
Nepal administrative map
Explore 14 named areas in Nepal. Each boundary is selectable and carries a stable identifier, so you can add your own values or distinguish neighbouring areas with a categorical colour scheme.
Open map →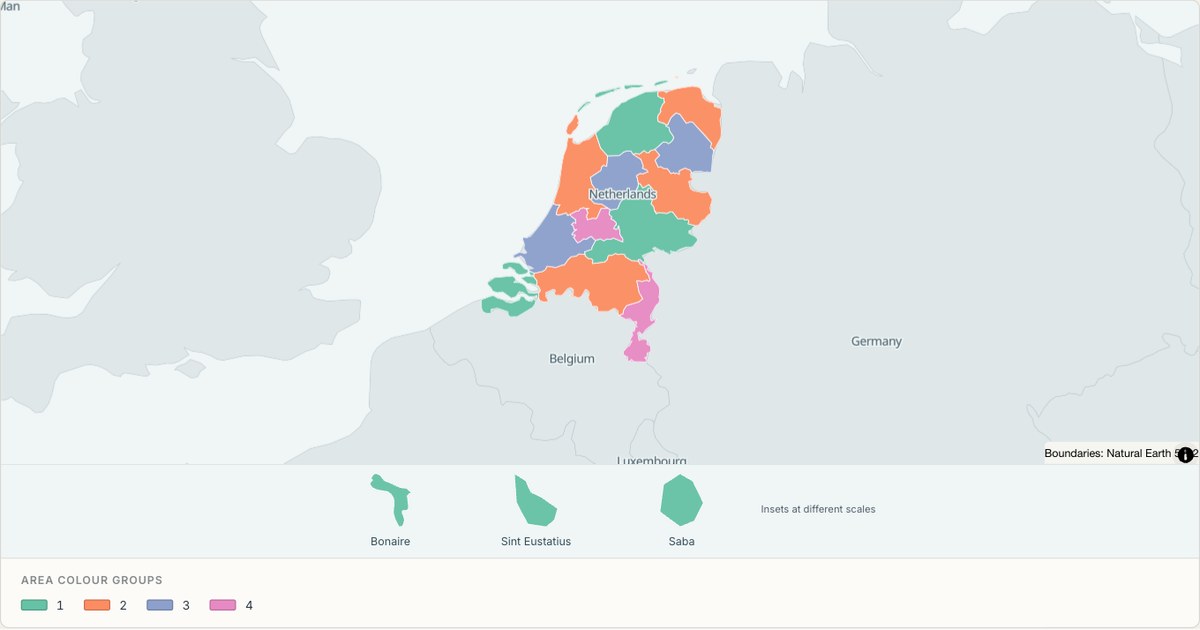 TopoJSONCategorical regions
Netherlands administrative map
Explore 15 named areas in Netherlands. Each boundary is selectable and carries a stable identifier, so you can add your own values or distinguish neighbouring areas with a categorical colour scheme.
Open map →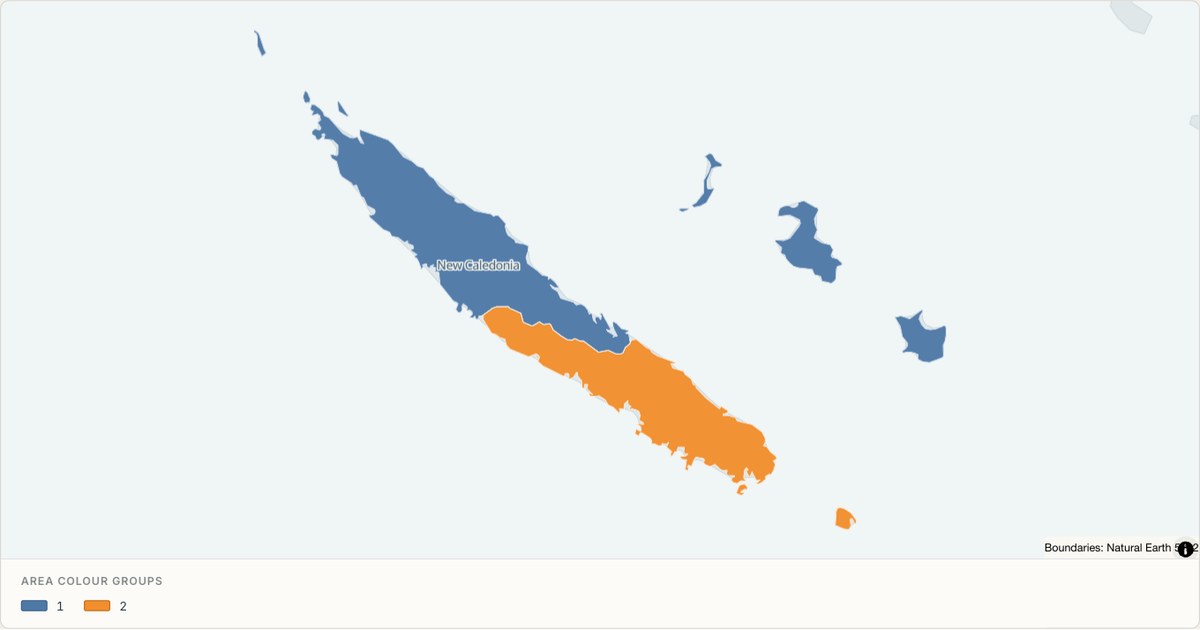 TopoJSONCategorical regions
New Caledonia administrative map
Explore 3 named areas in New Caledonia. Each boundary is selectable and carries a stable identifier, so you can add your own values or distinguish neighbouring areas with a categorical colour scheme.
Open map →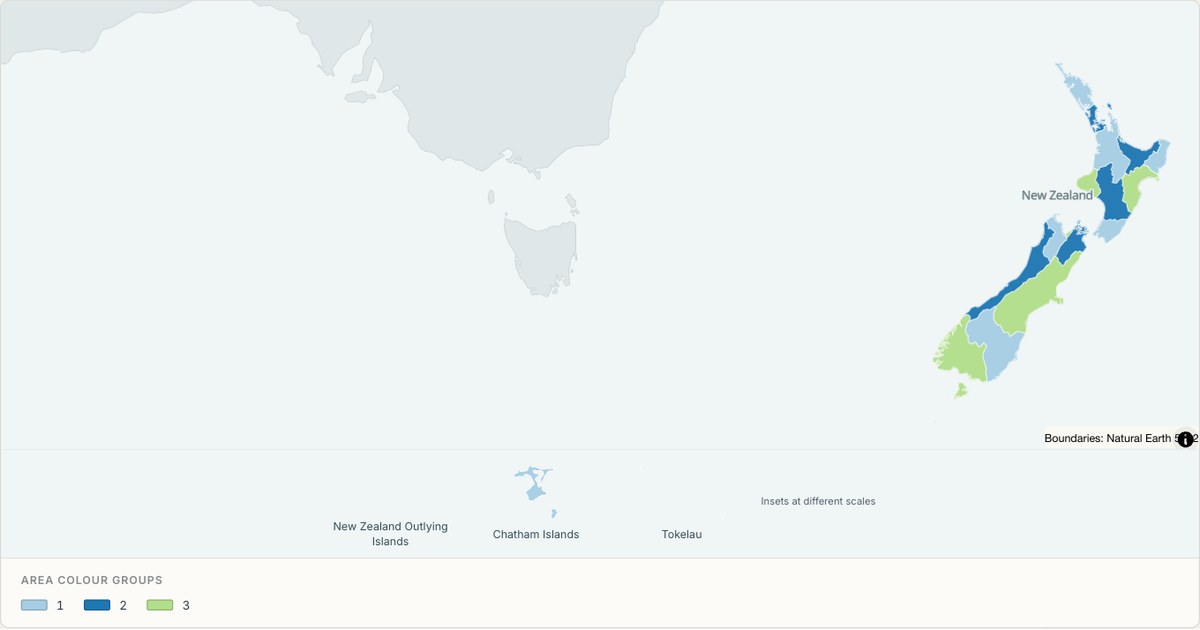 TopoJSONCategorical regions
New Zealand administrative map
Explore 24 named areas in New Zealand. Each boundary is selectable and carries a stable identifier, so you can add your own values or distinguish neighbouring areas with a categorical colour scheme.
Open map →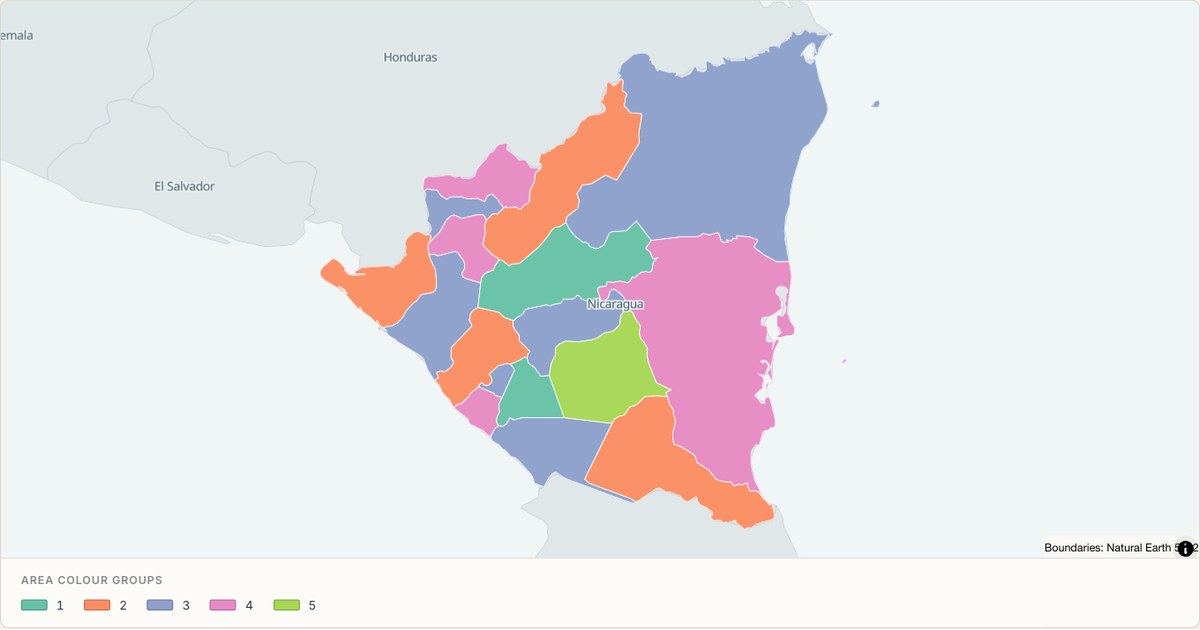 TopoJSONCategorical regions
Nicaragua administrative map
Explore 17 named areas in Nicaragua. Each boundary is selectable and carries a stable identifier, so you can add your own values or distinguish neighbouring areas with a categorical colour scheme.
Open map →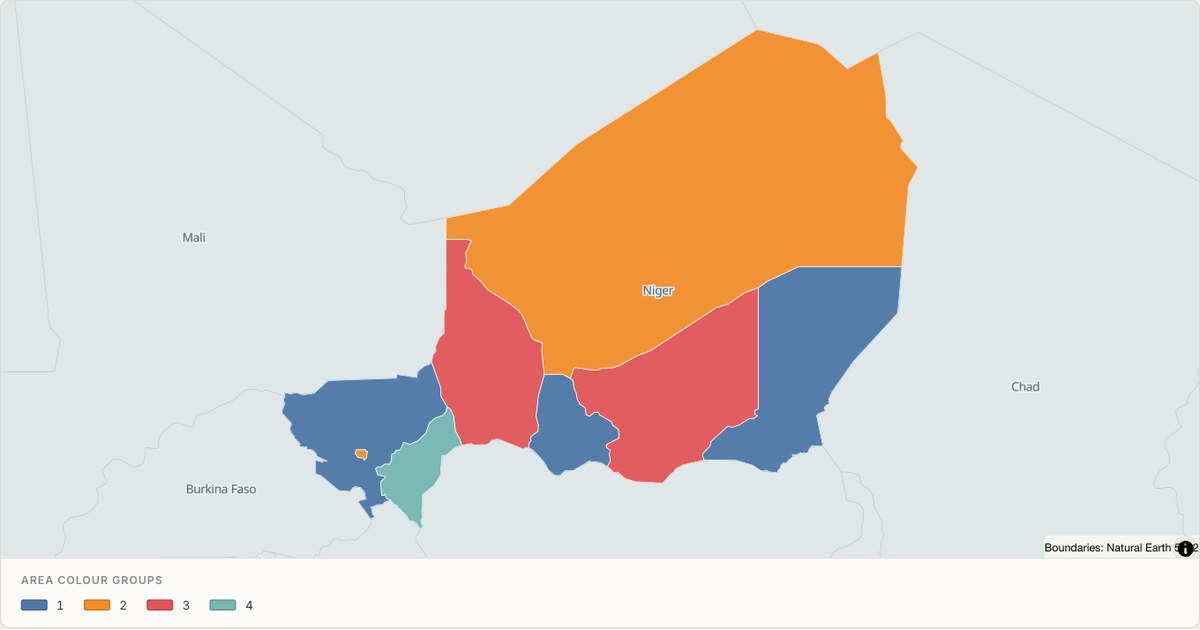 TopoJSONCategorical regions
Niger administrative map
Explore 8 named areas in Niger. Each boundary is selectable and carries a stable identifier, so you can add your own values or distinguish neighbouring areas with a categorical colour scheme.
Open map →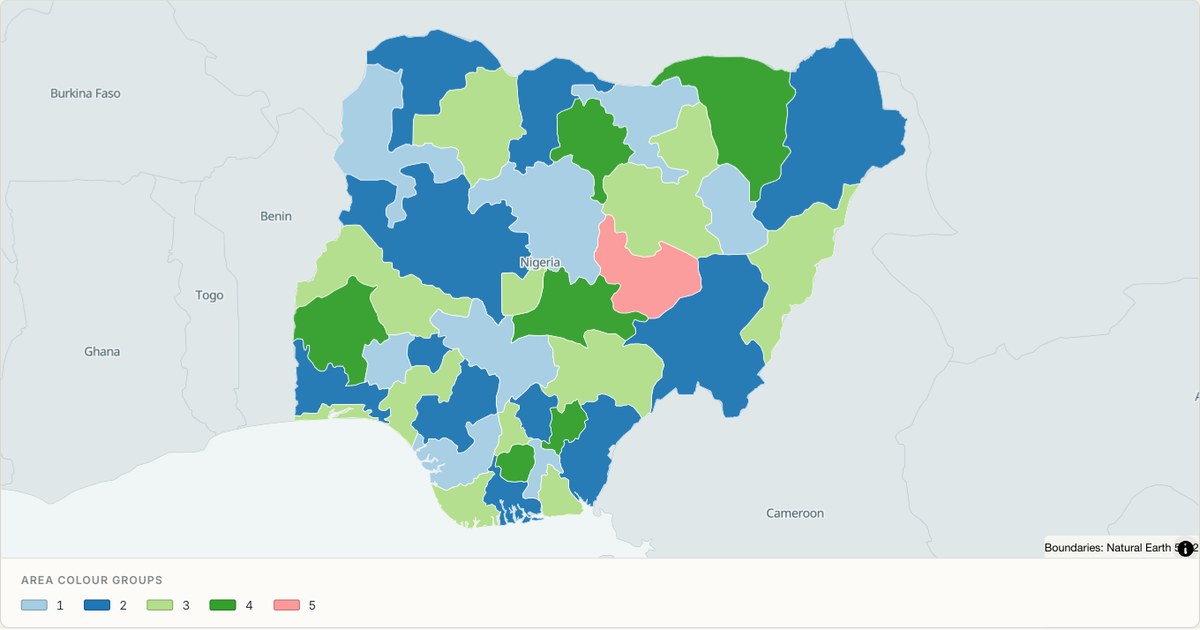 TopoJSONCategorical regions
Nigeria administrative map
Explore 37 named areas in Nigeria. Each boundary is selectable and carries a stable identifier, so you can add your own values or distinguish neighbouring areas with a categorical colour scheme.
Open map →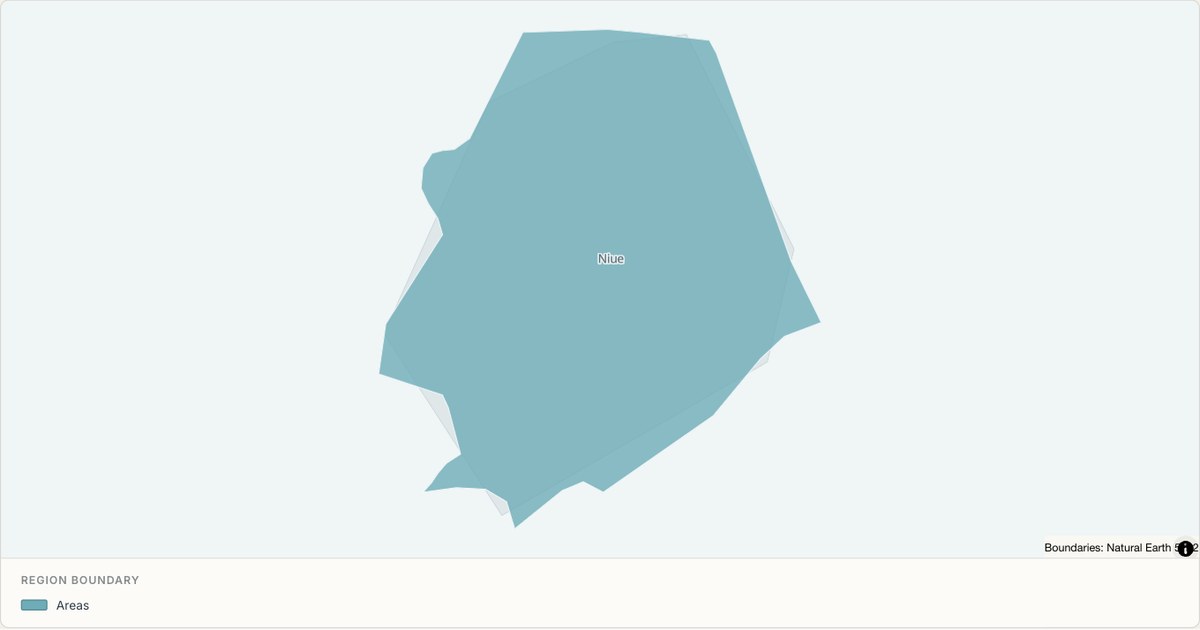 TopoJSONSingle boundary
Niue boundary map
Explore the boundary supplied for Niue. This snapshot contains one feature and does not provide internal subdivisions. Inspect its identifier and source attributes, or use it as a starting outline for your own map.
Open map →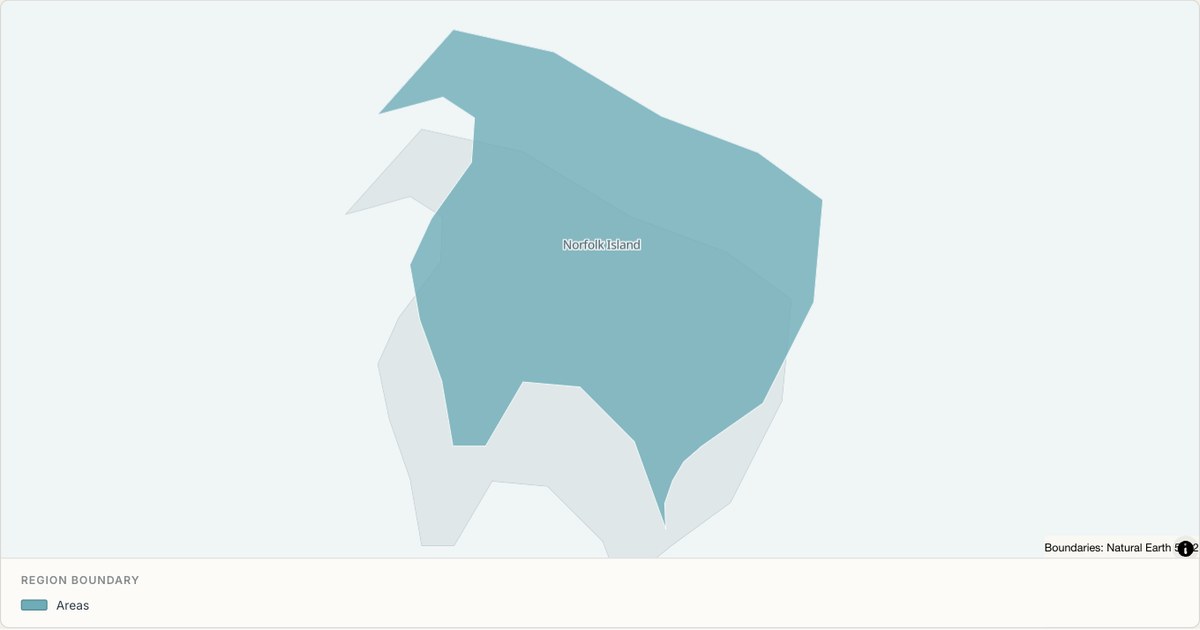 TopoJSONSingle boundary
Norfolk Island boundary map
Explore the boundary supplied for Norfolk Island. This snapshot contains one feature and does not provide internal subdivisions. Inspect its identifier and source attributes, or use it as a starting outline for your own map.
Open map →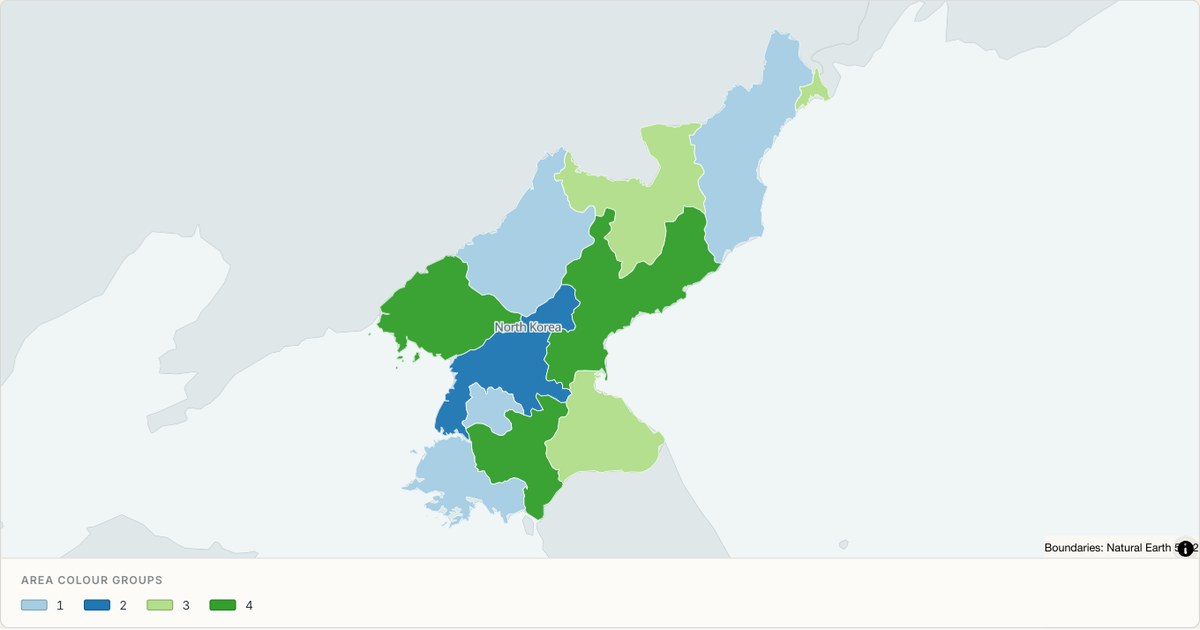 TopoJSONCategorical regions
North Korea administrative map
Explore 11 named areas in North Korea. Each boundary is selectable and carries a stable identifier, so you can add your own values or distinguish neighbouring areas with a categorical colour scheme.
Open map →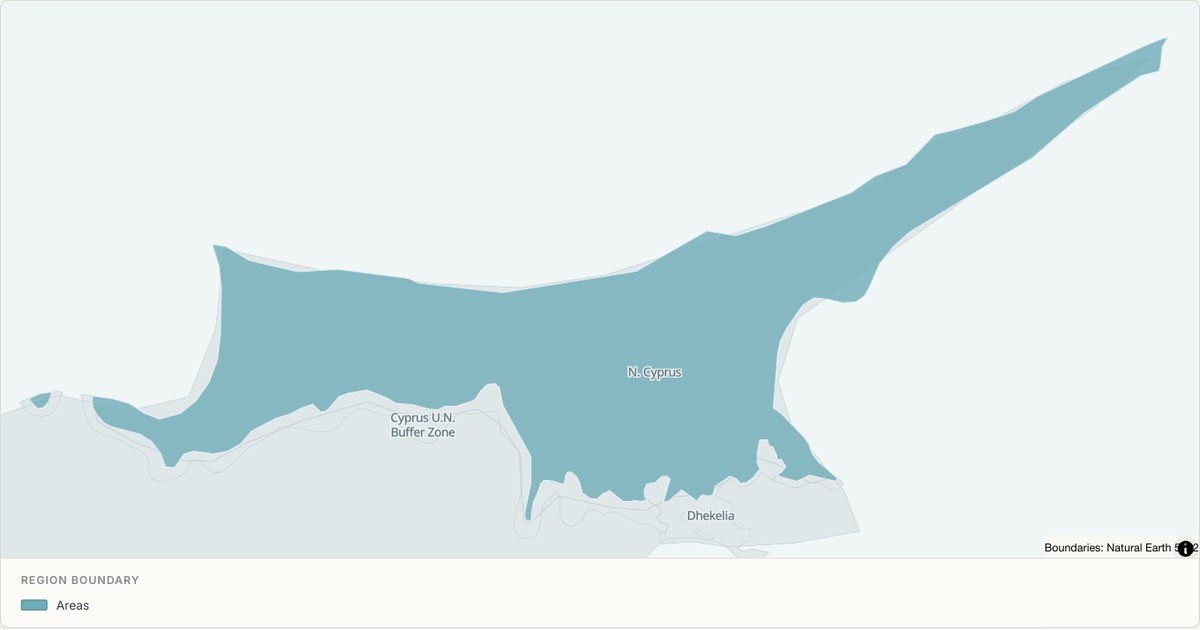 TopoJSONSingle boundary
Northern Cyprus boundary map
Explore the boundary supplied for Northern Cyprus. This snapshot contains one feature and does not provide internal subdivisions. Inspect its identifier and source attributes, or use it as a starting outline for your own map.
Open map →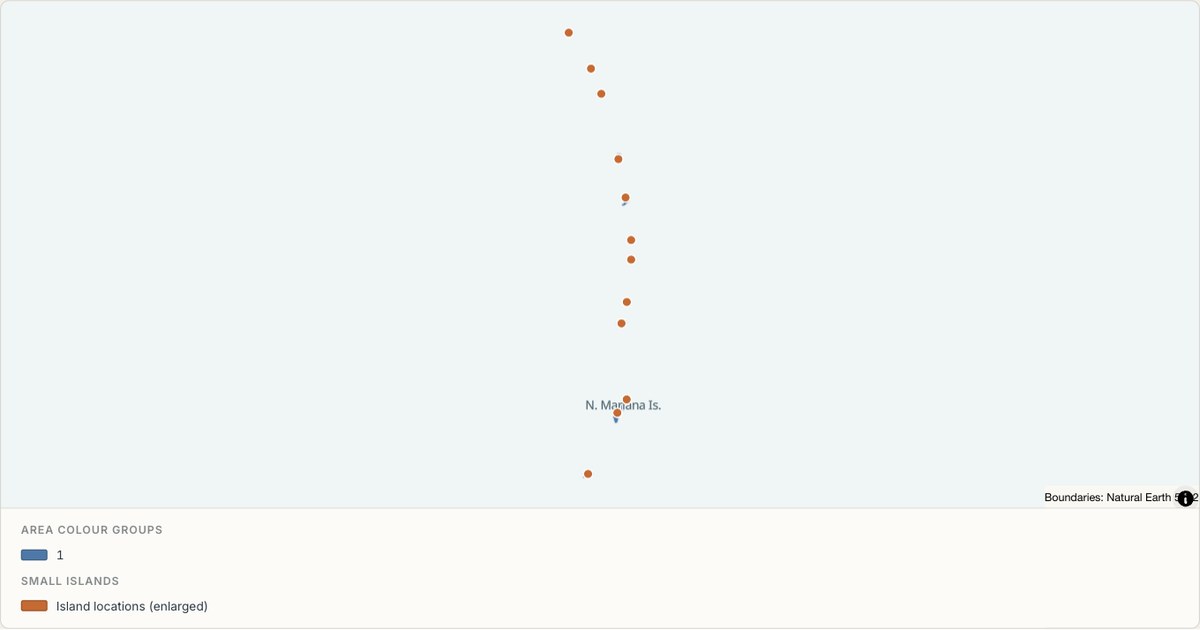 TopoJSONCategorical regions
Northern Mariana Islands administrative map
Explore 4 named areas in Northern Mariana Islands. Each boundary is selectable and carries a stable identifier, so you can add your own values or distinguish neighbouring areas with a categorical colour scheme.
Open map →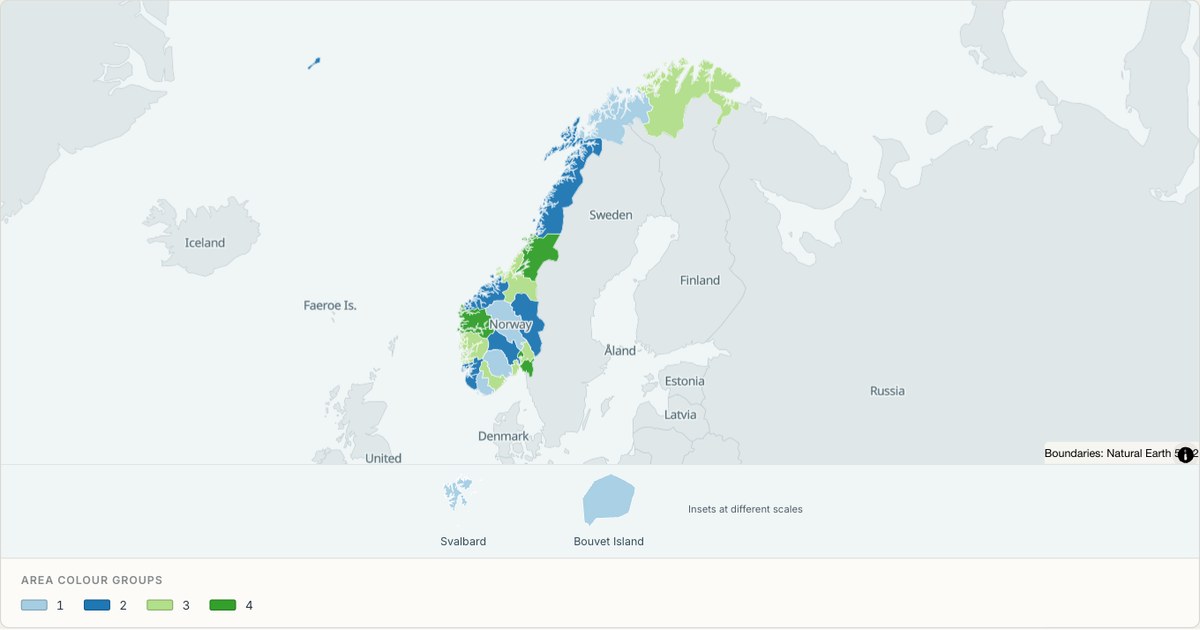 TopoJSONCategorical regions
Norway administrative map
Explore 21 named areas in Norway. Each boundary is selectable and carries a stable identifier, so you can add your own values or distinguish neighbouring areas with a categorical colour scheme.
Open map →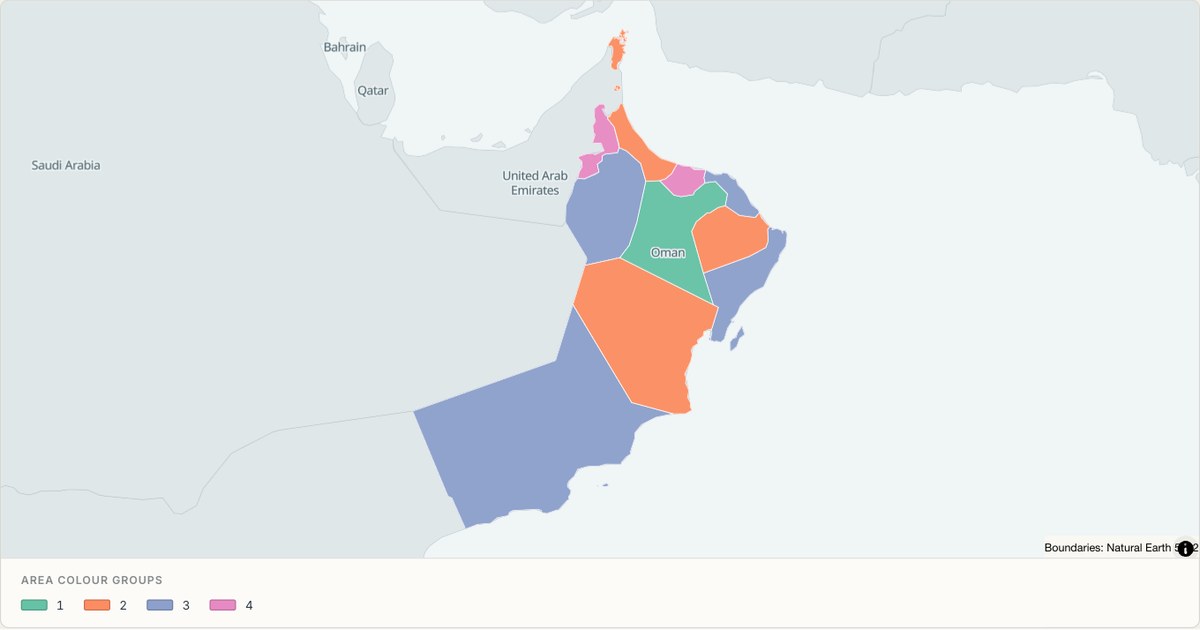 TopoJSONCategorical regions
Oman administrative map
Explore 11 named areas in Oman. Each boundary is selectable and carries a stable identifier, so you can add your own values or distinguish neighbouring areas with a categorical colour scheme.
Open map →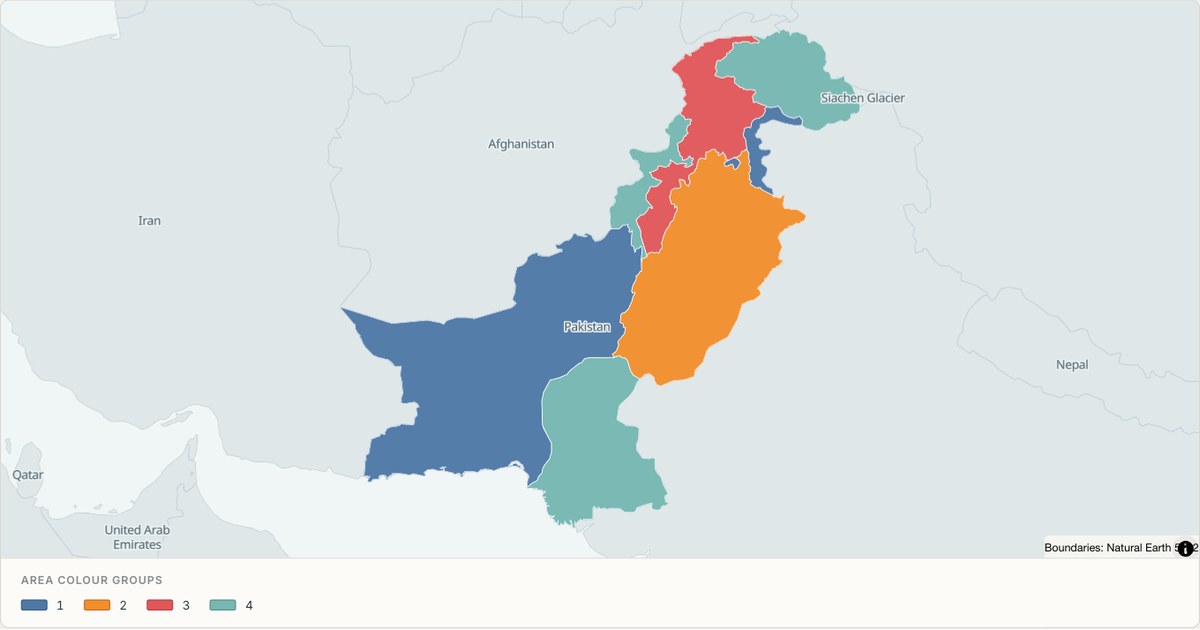 TopoJSONCategorical regions
Pakistan administrative map
Explore 8 named areas in Pakistan. Each boundary is selectable and carries a stable identifier, so you can add your own values or distinguish neighbouring areas with a categorical colour scheme.
Open map →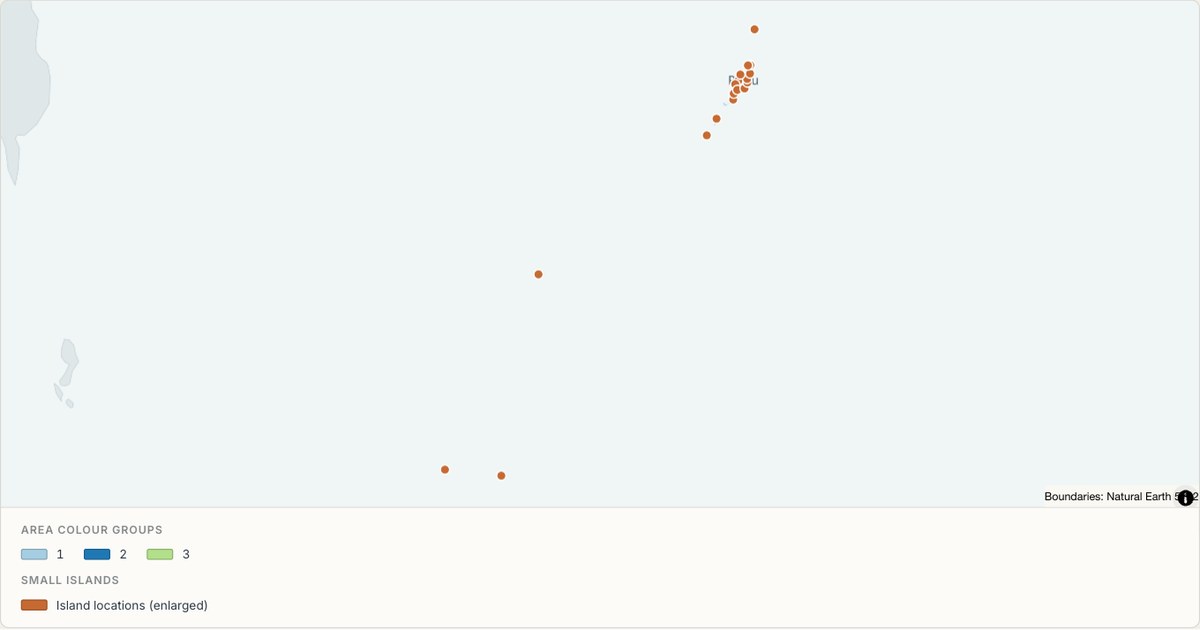 TopoJSONCategorical regions
Palau administrative map
Explore 16 named areas in Palau. Each boundary is selectable and carries a stable identifier, so you can add your own values or distinguish neighbouring areas with a categorical colour scheme.
Open map →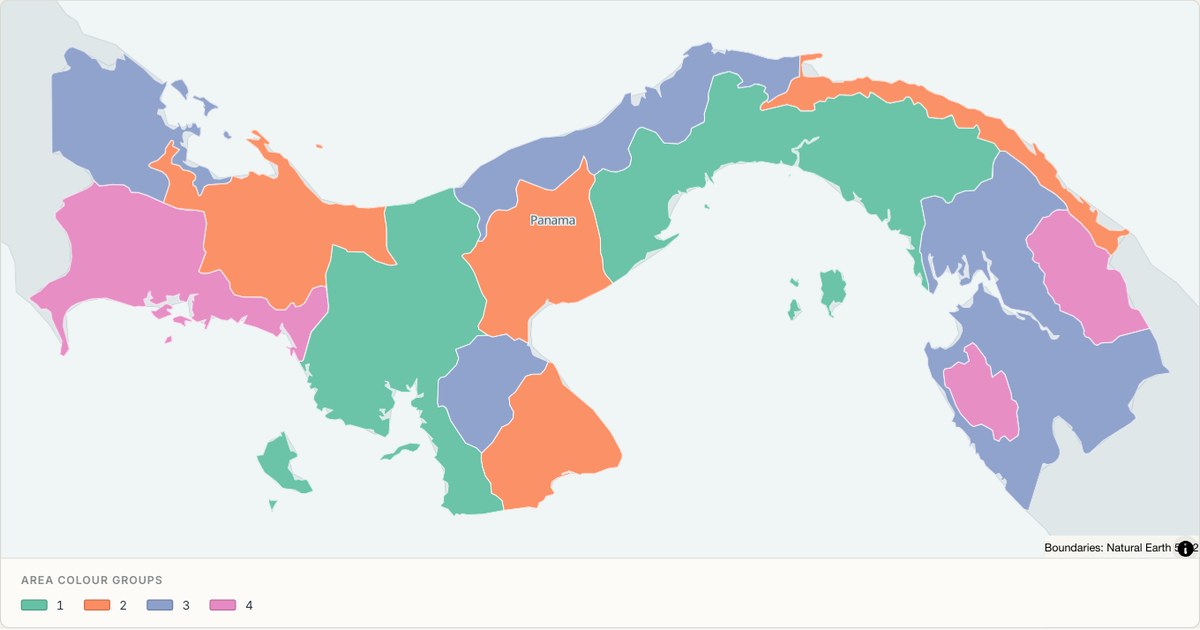 TopoJSONCategorical regions
Panama administrative map
Explore 12 named areas in Panama. Each boundary is selectable and carries a stable identifier, so you can add your own values or distinguish neighbouring areas with a categorical colour scheme.
Open map →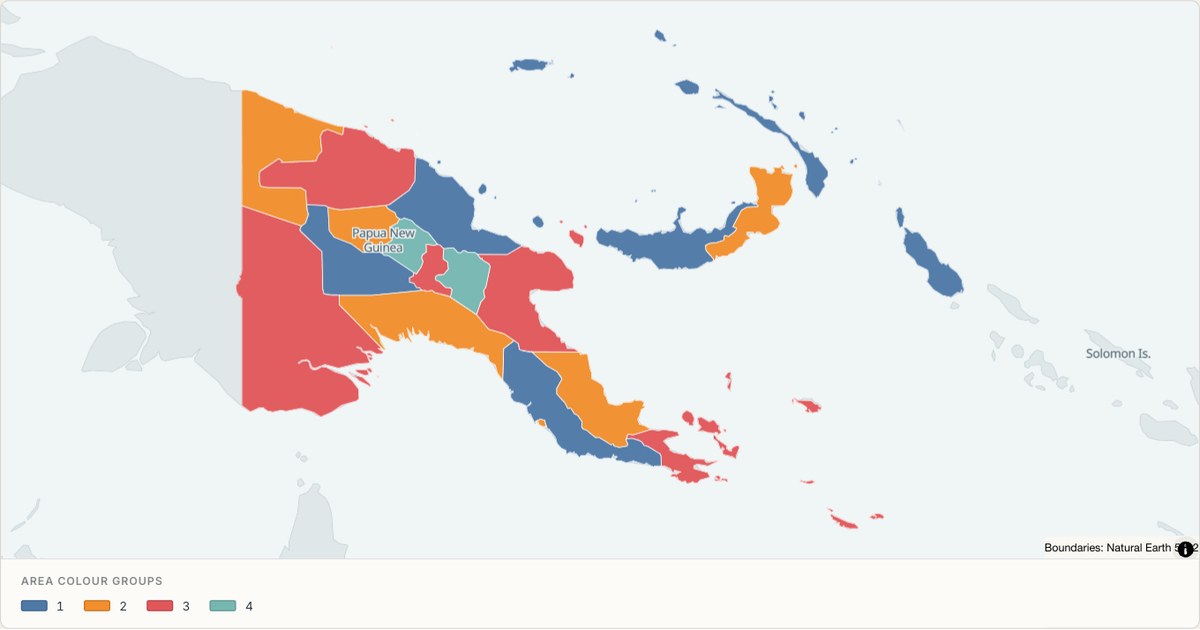 TopoJSONCategorical regions
Papua New Guinea administrative map
Explore 20 named areas in Papua New Guinea. Each boundary is selectable and carries a stable identifier, so you can add your own values or distinguish neighbouring areas with a categorical colour scheme.
Open map →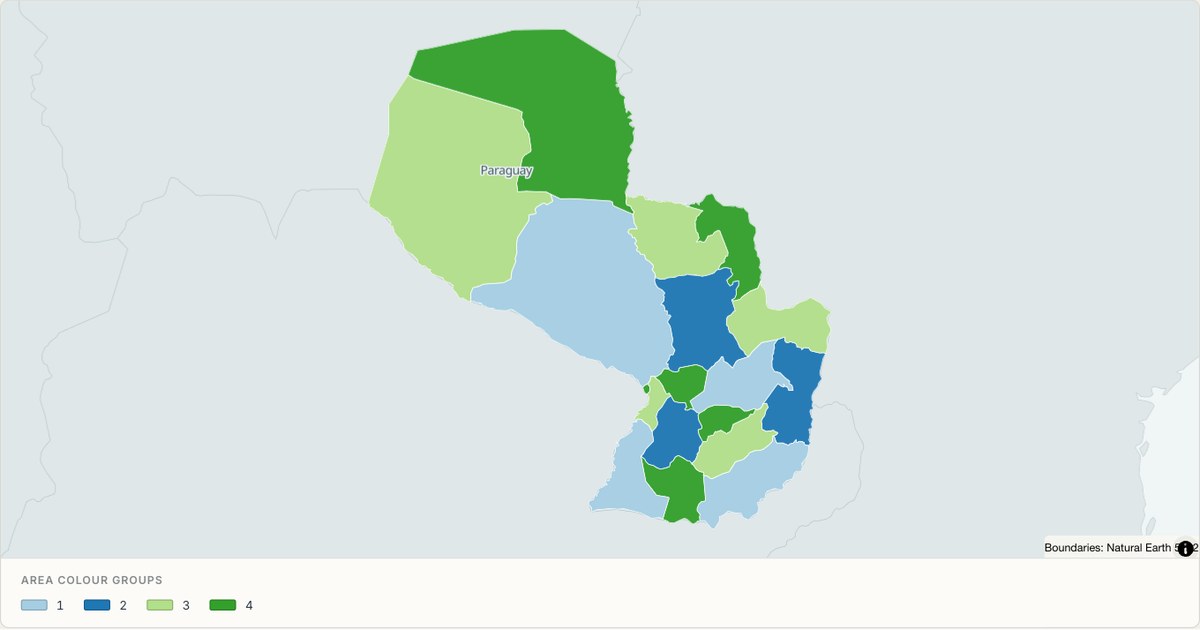 TopoJSONCategorical regions
Paraguay administrative map
Explore 18 named areas in Paraguay. Each boundary is selectable and carries a stable identifier, so you can add your own values or distinguish neighbouring areas with a categorical colour scheme.
Open map →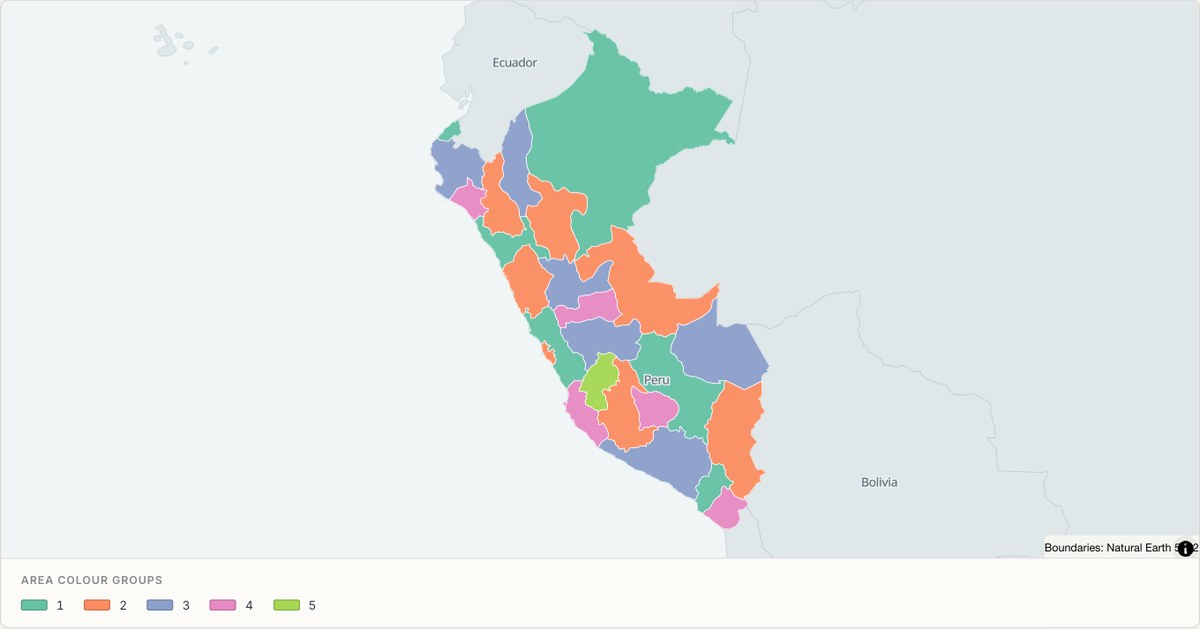 TopoJSONCategorical regions
Peru administrative map
Explore 26 named areas in Peru. Each boundary is selectable and carries a stable identifier, so you can add your own values or distinguish neighbouring areas with a categorical colour scheme.
Open map →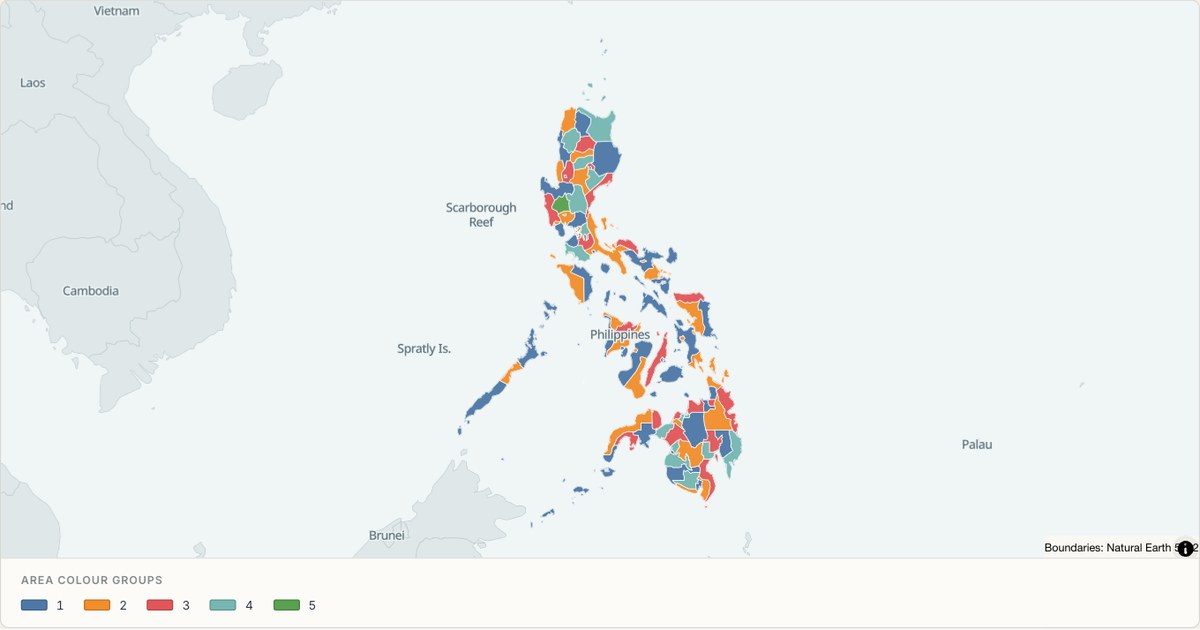 TopoJSONCategorical regions
Philippines administrative map
Explore 118 named areas in Philippines. Each boundary is selectable and carries a stable identifier, so you can add your own values or distinguish neighbouring areas with a categorical colour scheme.
Open map → TopoJSONSingle boundary
Pitcairn Islands boundary map
Explore the boundary supplied for Pitcairn Islands. This snapshot contains one feature and does not provide internal subdivisions. Inspect its identifier and source attributes, or use it as a starting outline for your own map.
Open map →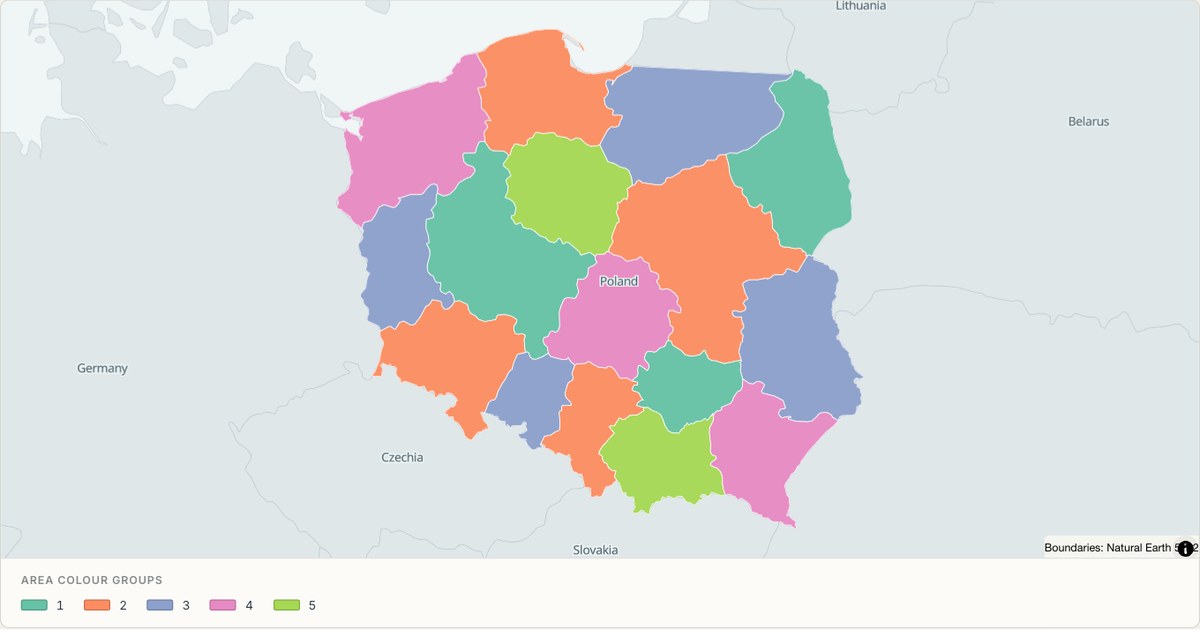 TopoJSONCategorical regions
Poland administrative map
Explore 16 named areas in Poland. Each boundary is selectable and carries a stable identifier, so you can add your own values or distinguish neighbouring areas with a categorical colour scheme.
Open map →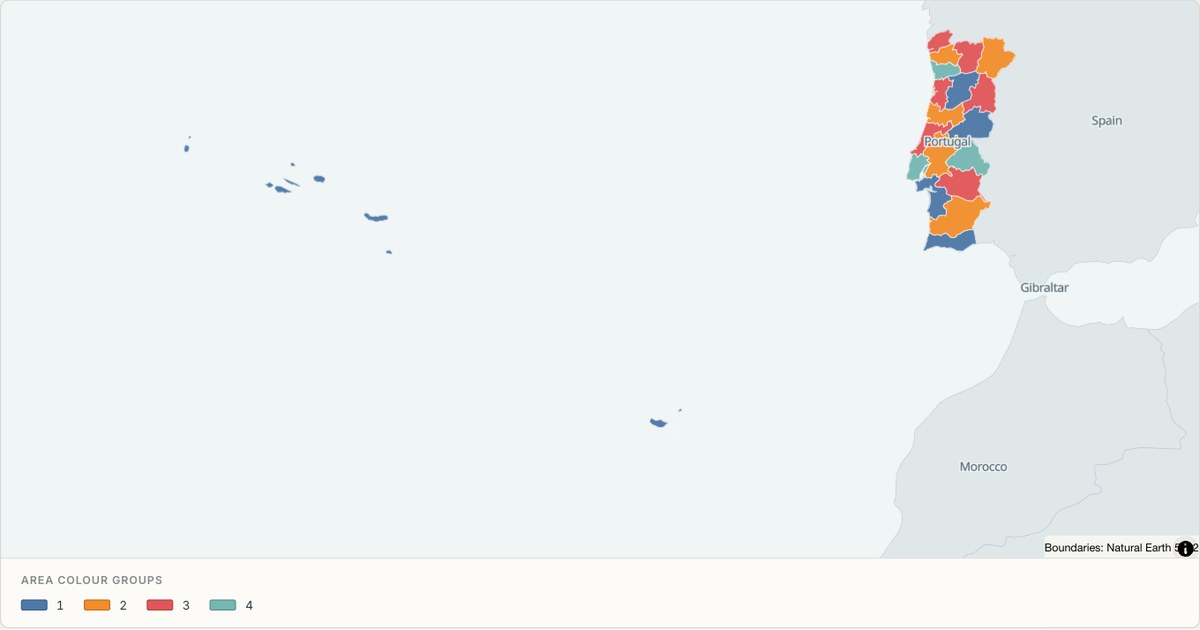 TopoJSONCategorical regions
Portugal administrative map
Explore 20 named areas in Portugal. Each boundary is selectable and carries a stable identifier, so you can add your own values or distinguish neighbouring areas with a categorical colour scheme.
Open map →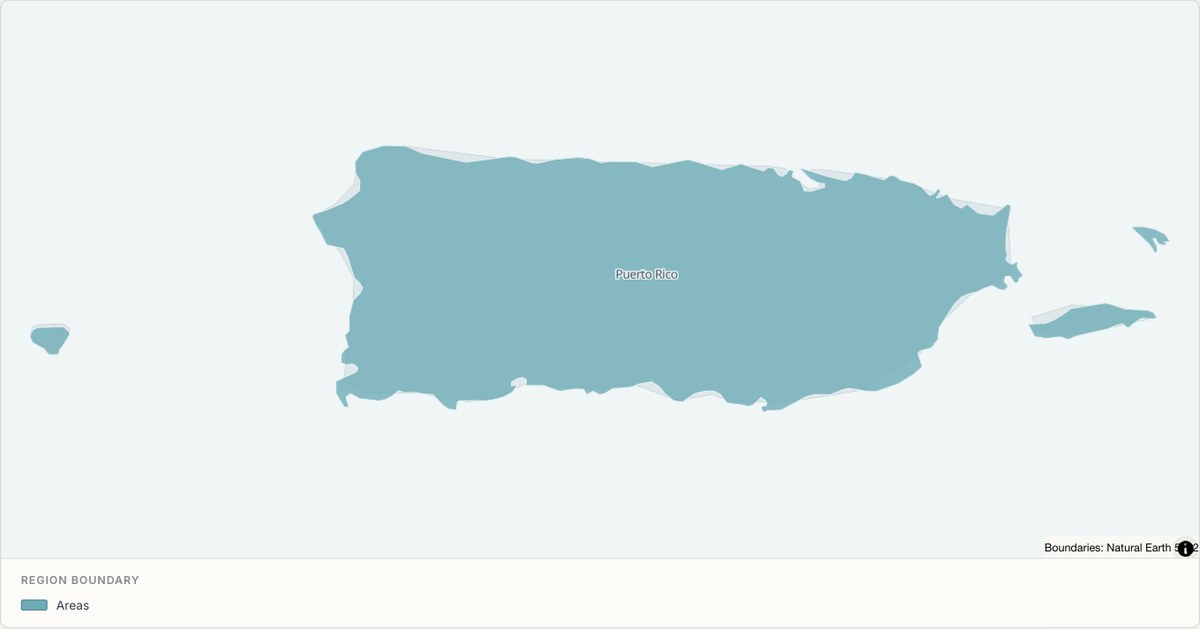 TopoJSONSingle boundary
Puerto Rico boundary map
Explore the boundary supplied for Puerto Rico. This snapshot contains one feature and does not provide internal subdivisions. Inspect its identifier and source attributes, or use it as a starting outline for your own map.
Open map →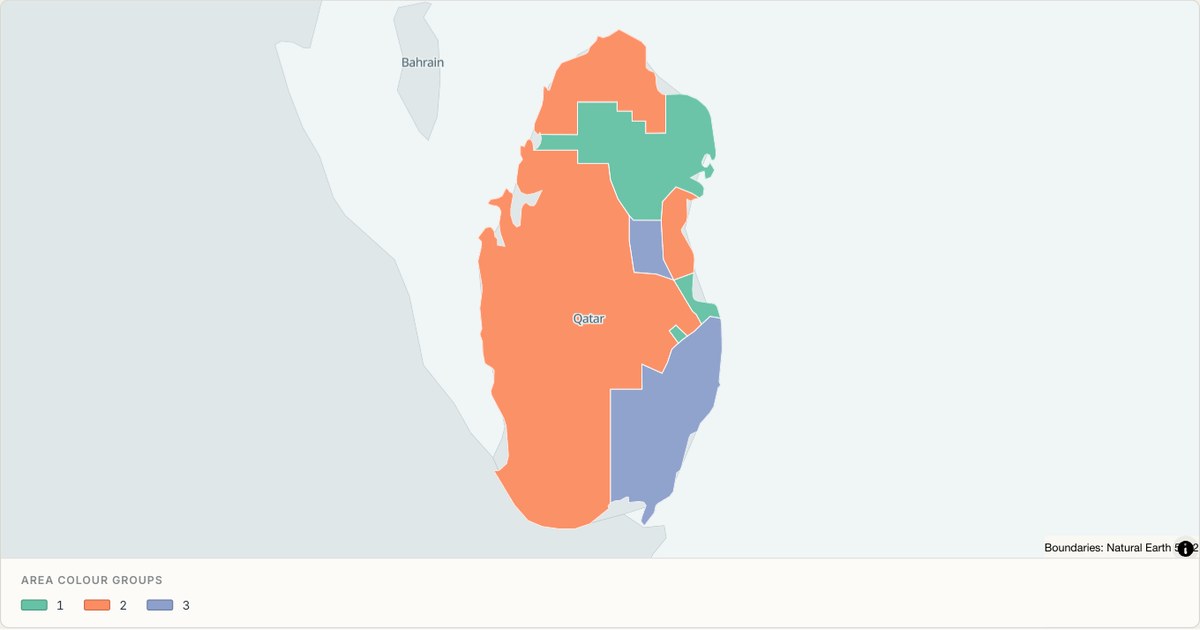 TopoJSONCategorical regions
Qatar administrative map
Explore 7 named areas in Qatar. Each boundary is selectable and carries a stable identifier, so you can add your own values or distinguish neighbouring areas with a categorical colour scheme.
Open map →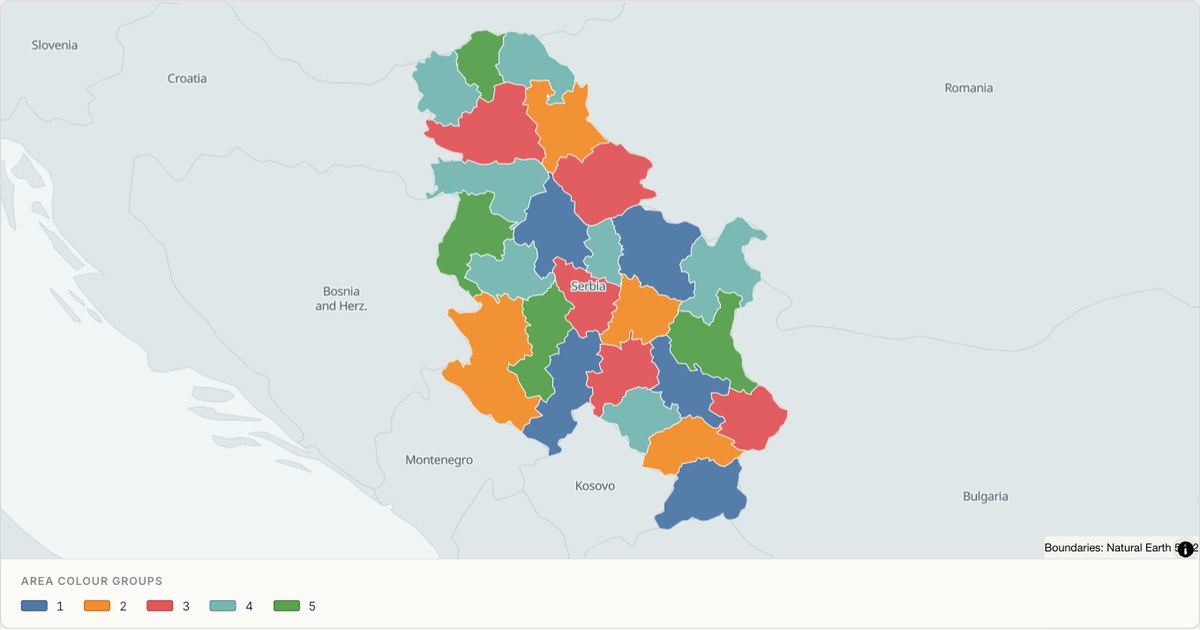 TopoJSONCategorical regions
Republic of Serbia administrative map
Explore 25 named areas in Republic of Serbia. Each boundary is selectable and carries a stable identifier, so you can add your own values or distinguish neighbouring areas with a categorical colour scheme.
Open map →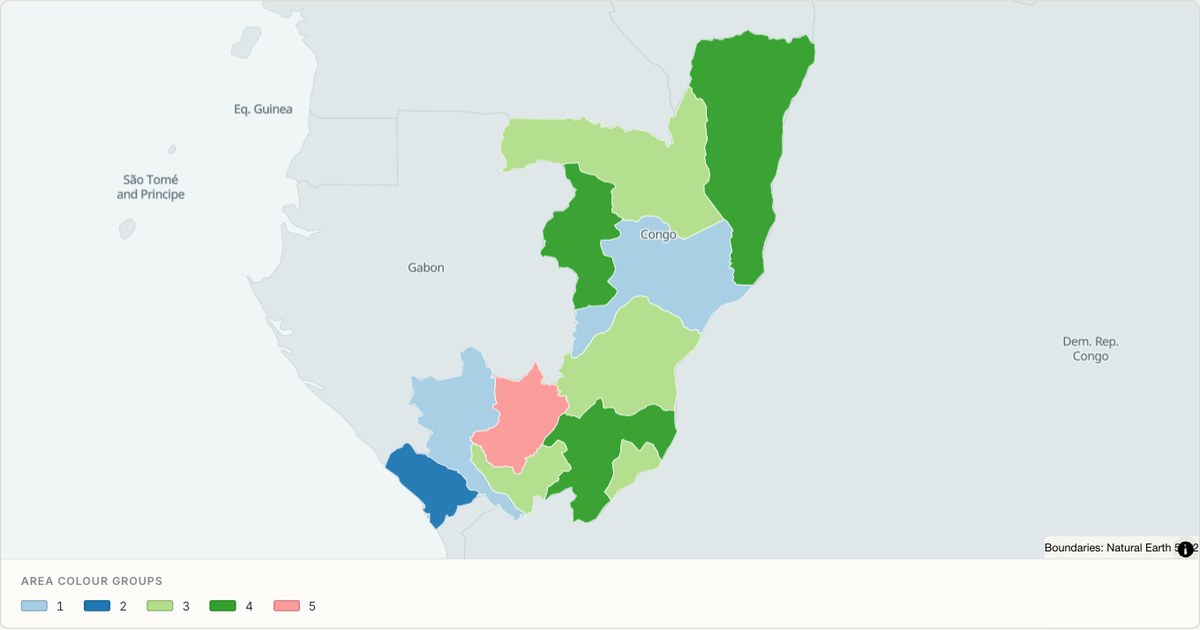 TopoJSONCategorical regions
Republic of the Congo administrative map
Explore 12 named areas in Republic of the Congo. Each boundary is selectable and carries a stable identifier, so you can add your own values or distinguish neighbouring areas with a categorical colour scheme.
Open map →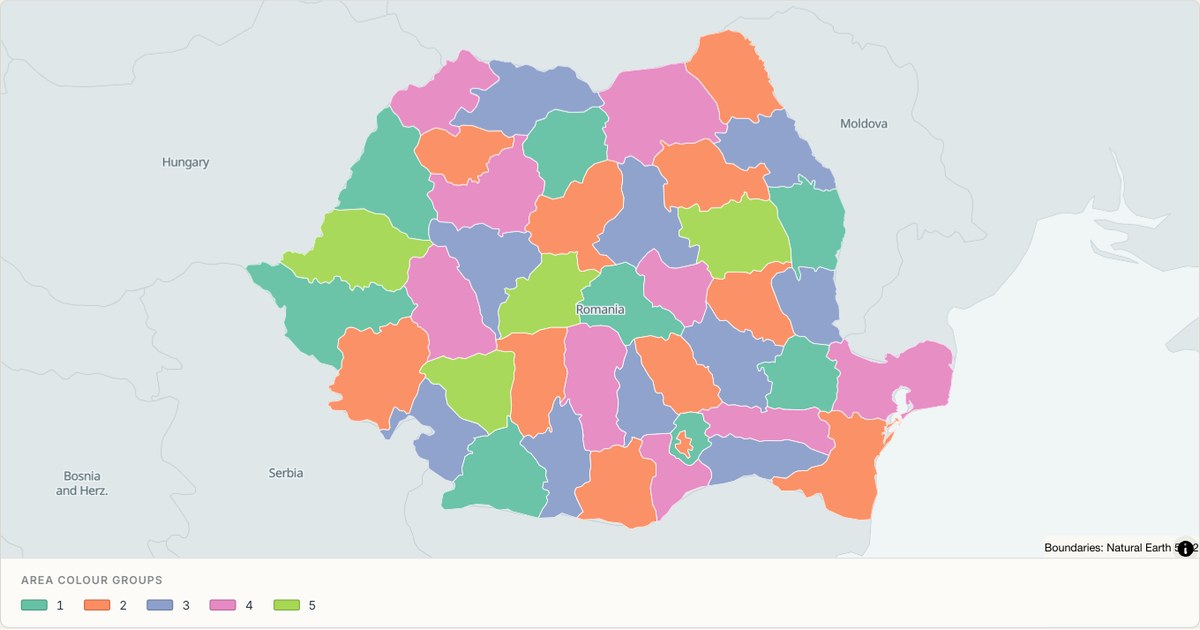 TopoJSONCategorical regions
Romania administrative map
Explore 42 named areas in Romania. Each boundary is selectable and carries a stable identifier, so you can add your own values or distinguish neighbouring areas with a categorical colour scheme.
Open map →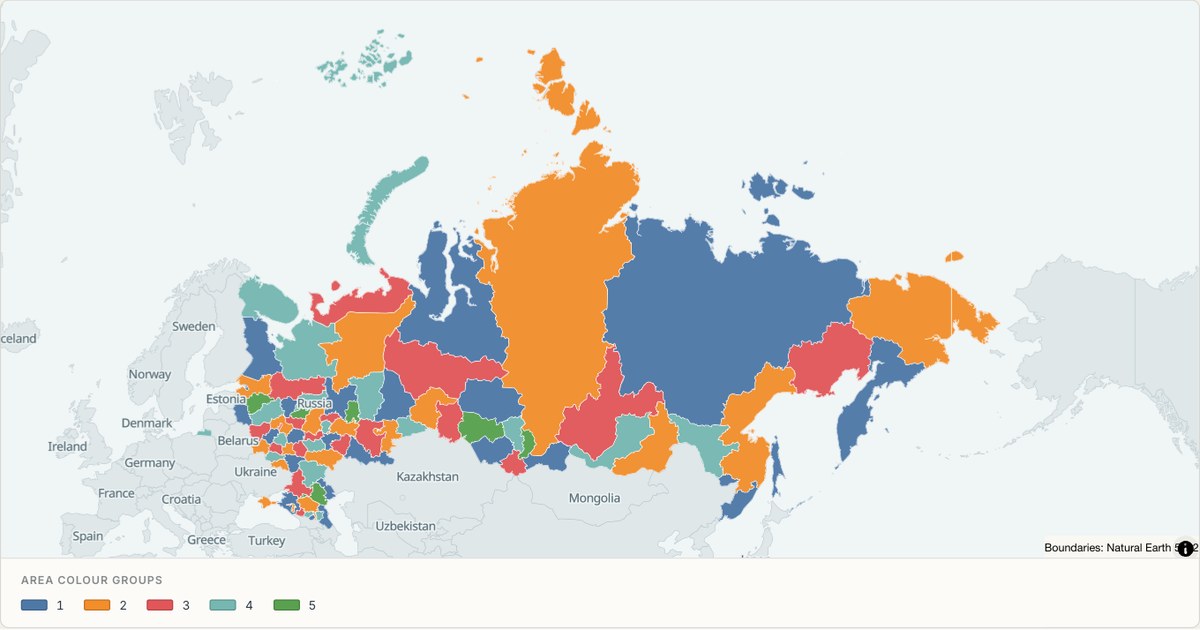 TopoJSONCategorical regions
Russia administrative map
Explore 86 named areas in Russia. Each boundary is selectable and carries a stable identifier, so you can add your own values or distinguish neighbouring areas with a categorical colour scheme.
Open map →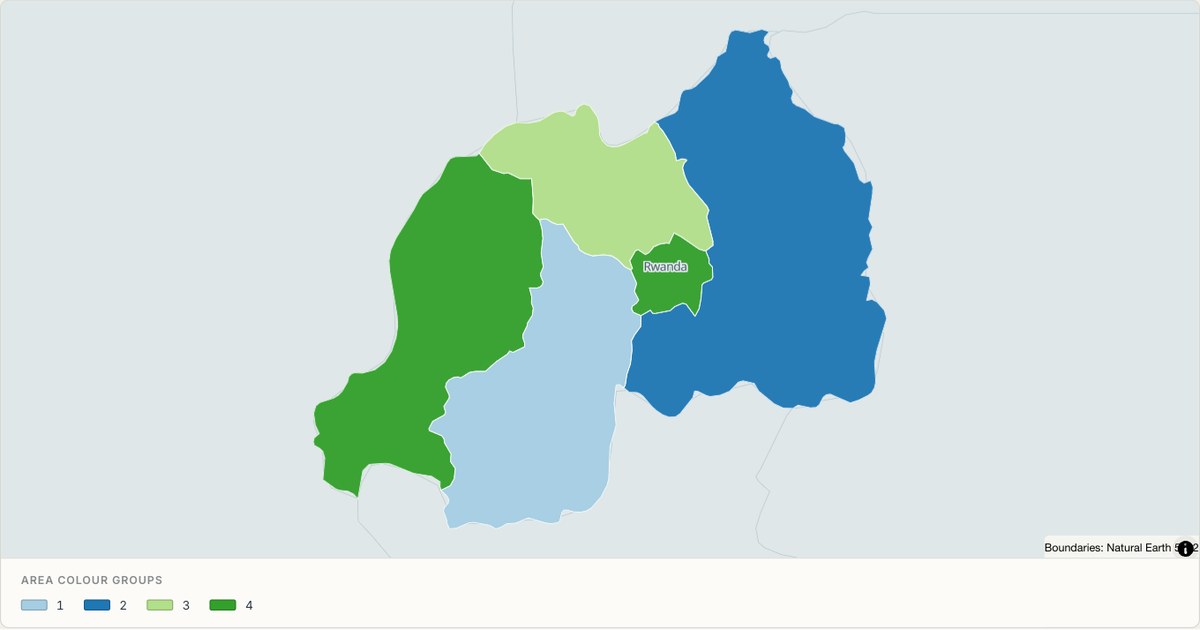 TopoJSONCategorical regions
Rwanda administrative map
Explore 5 named areas in Rwanda. Each boundary is selectable and carries a stable identifier, so you can add your own values or distinguish neighbouring areas with a categorical colour scheme.
Open map →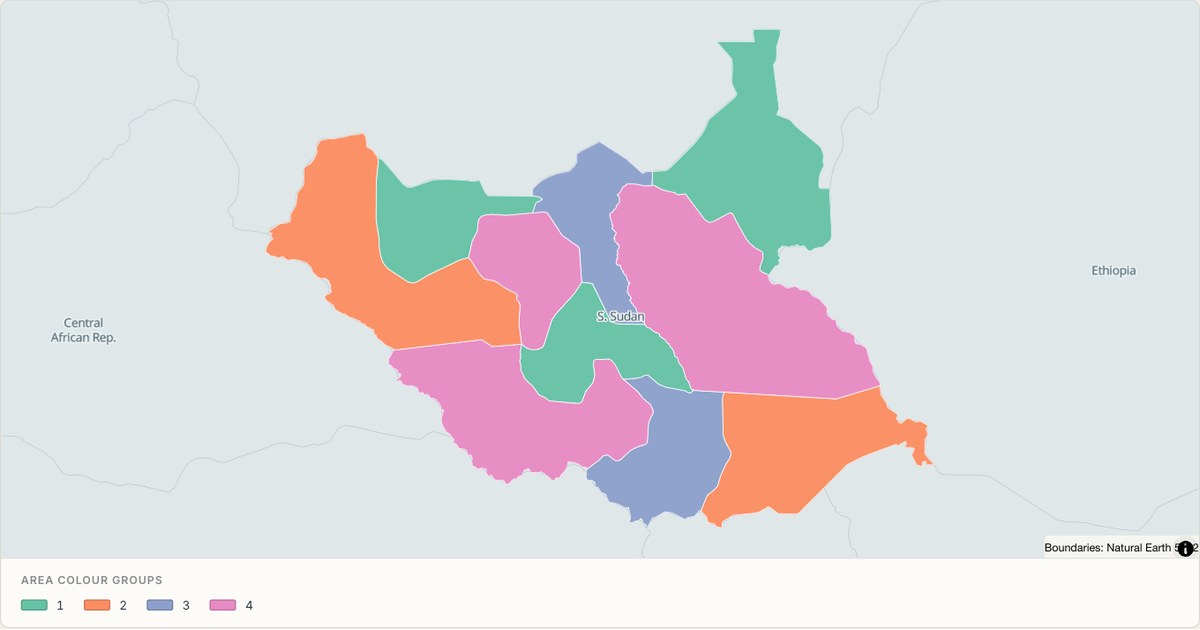 TopoJSONCategorical regions
S. Sudan administrative map
Explore 10 named areas in S. Sudan. Each boundary is selectable and carries a stable identifier, so you can add your own values or distinguish neighbouring areas with a categorical colour scheme.
Open map →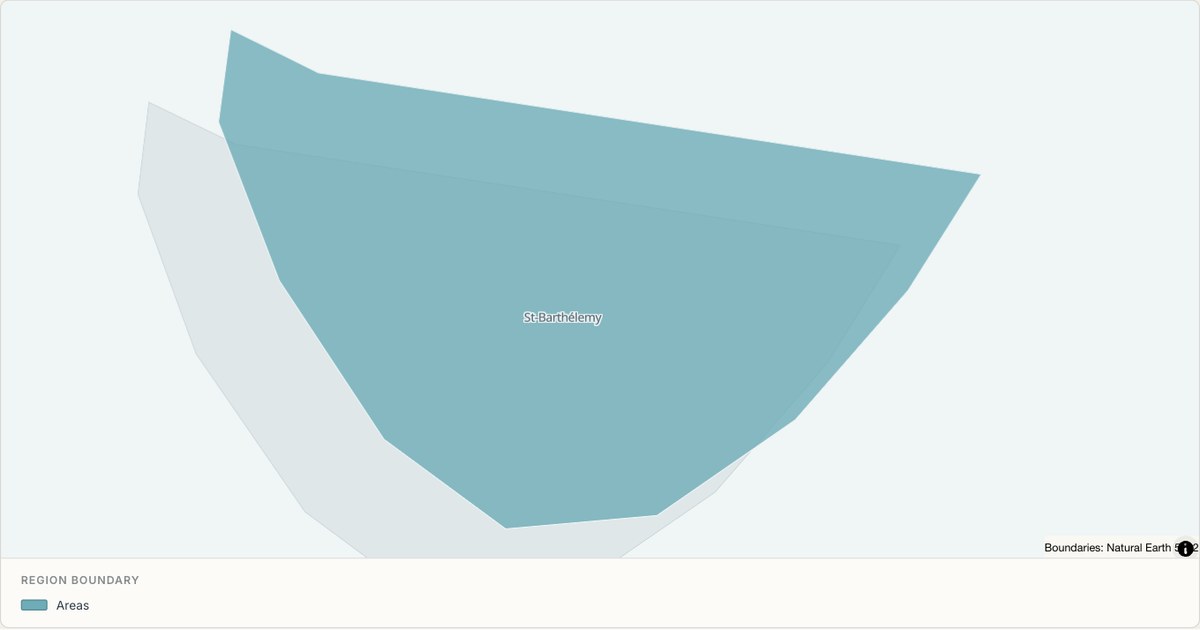 TopoJSONSingle boundary
Saint Barthelemy boundary map
Explore the boundary supplied for Saint Barthelemy. This snapshot contains one feature and does not provide internal subdivisions. Inspect its identifier and source attributes, or use it as a starting outline for your own map.
Open map →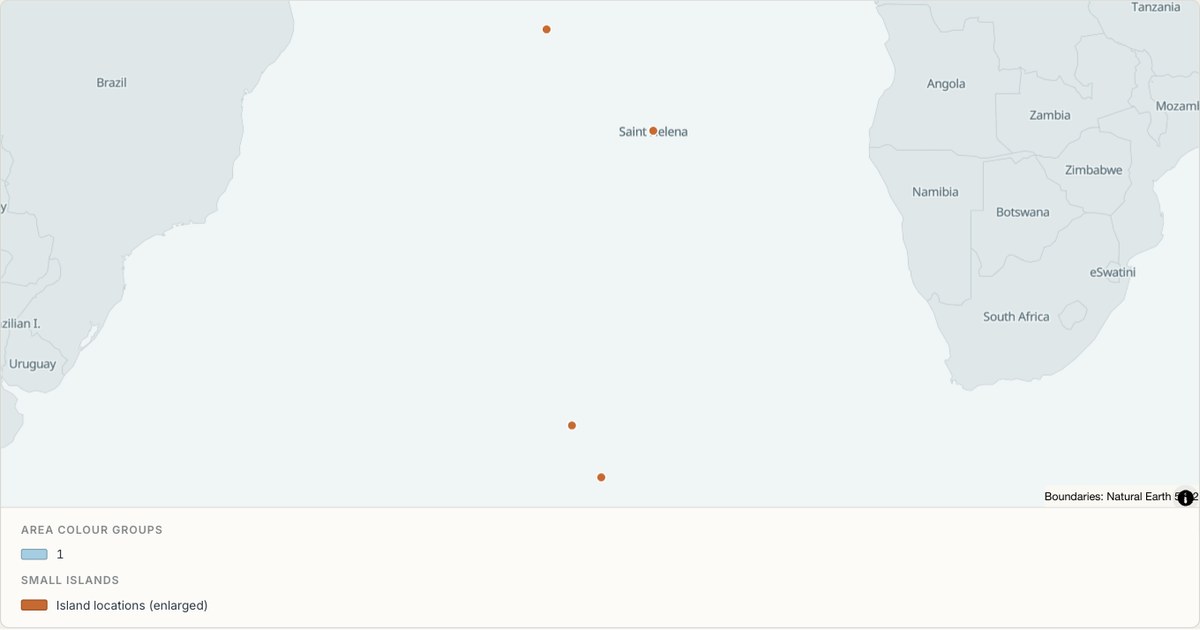 TopoJSONCategorical regions
Saint Helena administrative map
Explore 3 named areas in Saint Helena. Each boundary is selectable and carries a stable identifier, so you can add your own values or distinguish neighbouring areas with a categorical colour scheme.
Open map →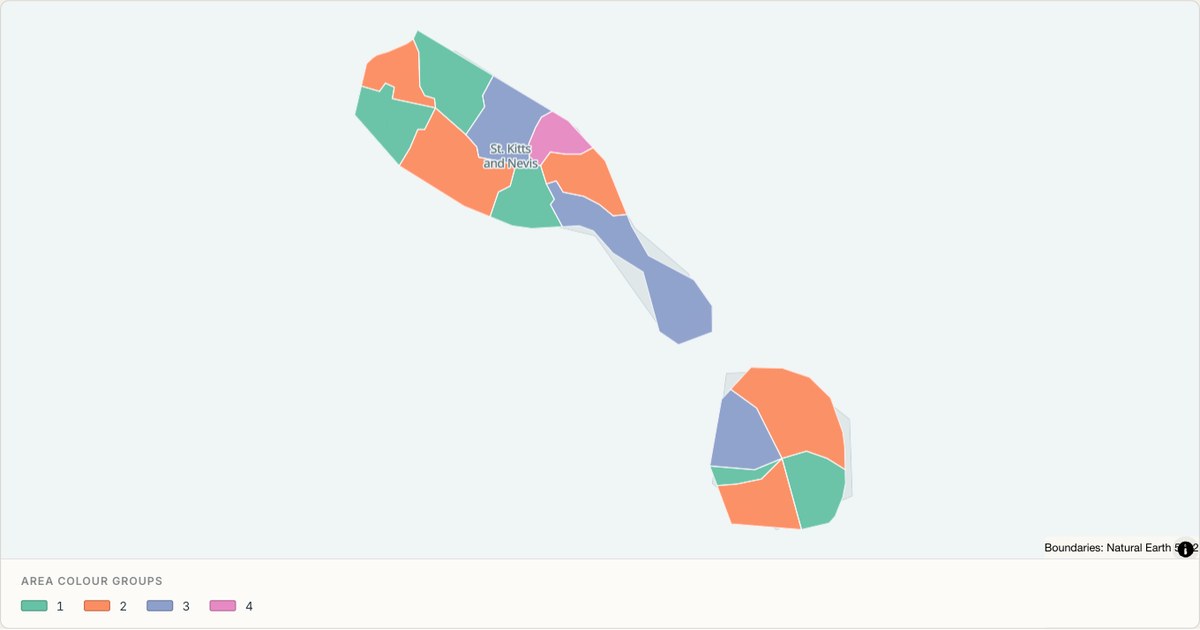 TopoJSONCategorical regions
Saint Kitts and Nevis administrative map
Explore 14 named areas in Saint Kitts and Nevis. Each boundary is selectable and carries a stable identifier, so you can add your own values or distinguish neighbouring areas with a categorical colour scheme.
Open map →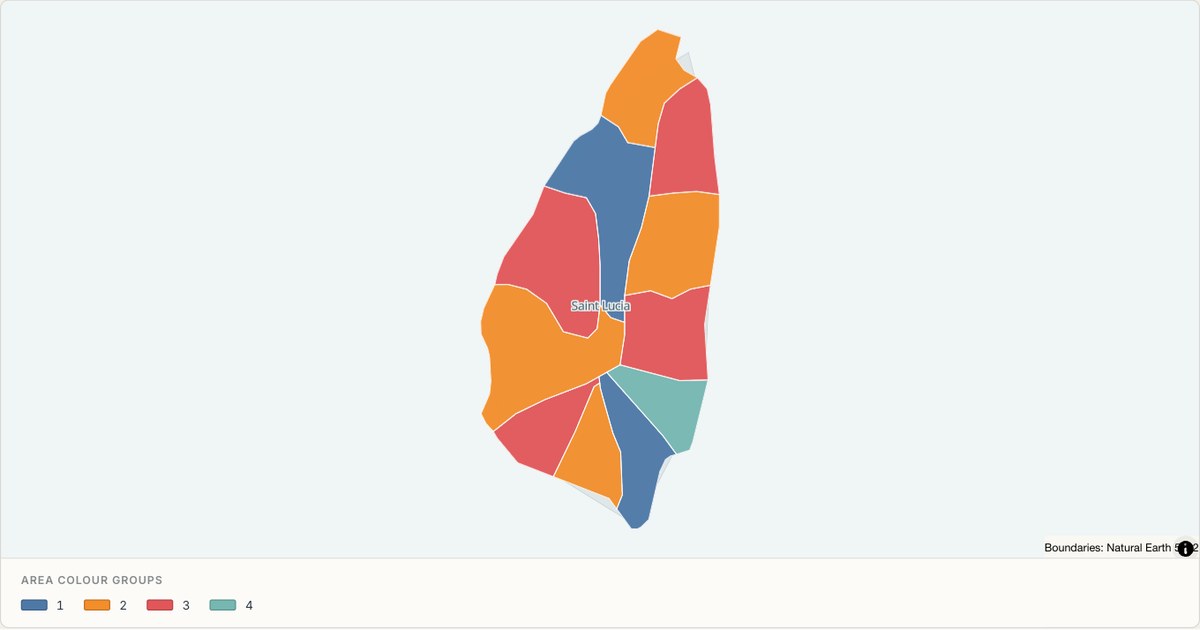 TopoJSONCategorical regions
Saint Lucia administrative map
Explore 11 named areas in Saint Lucia. Each boundary is selectable and carries a stable identifier, so you can add your own values or distinguish neighbouring areas with a categorical colour scheme.
Open map →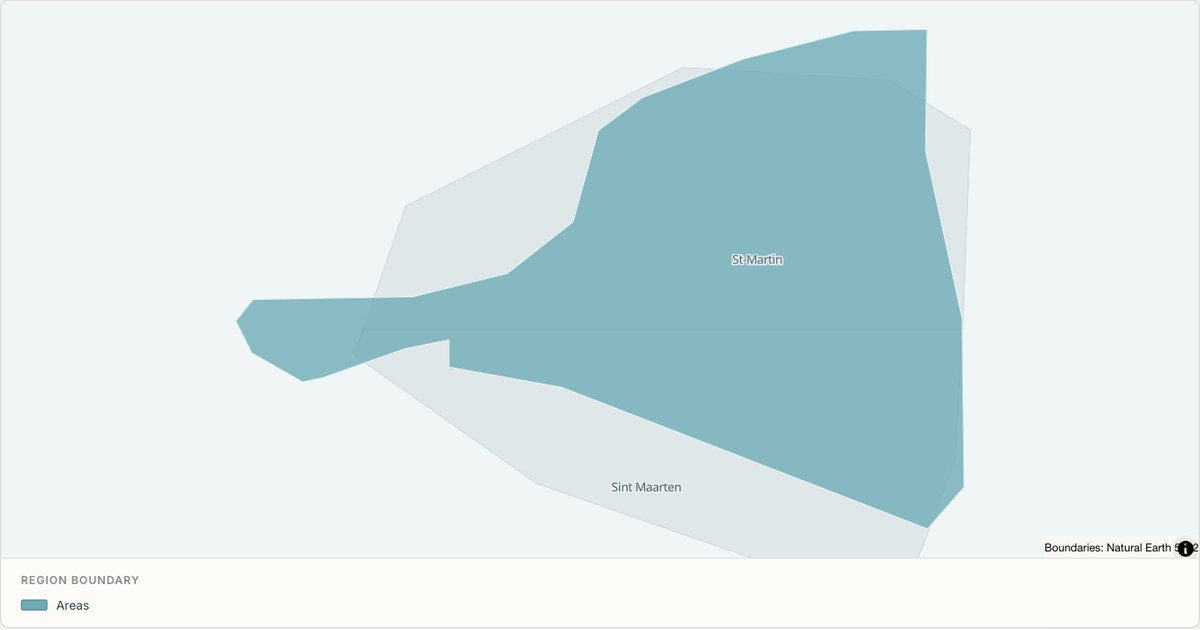 TopoJSONSingle boundary
Saint Martin boundary map
Explore the boundary supplied for Saint Martin. This snapshot contains one feature and does not provide internal subdivisions. Inspect its identifier and source attributes, or use it as a starting outline for your own map.
Open map →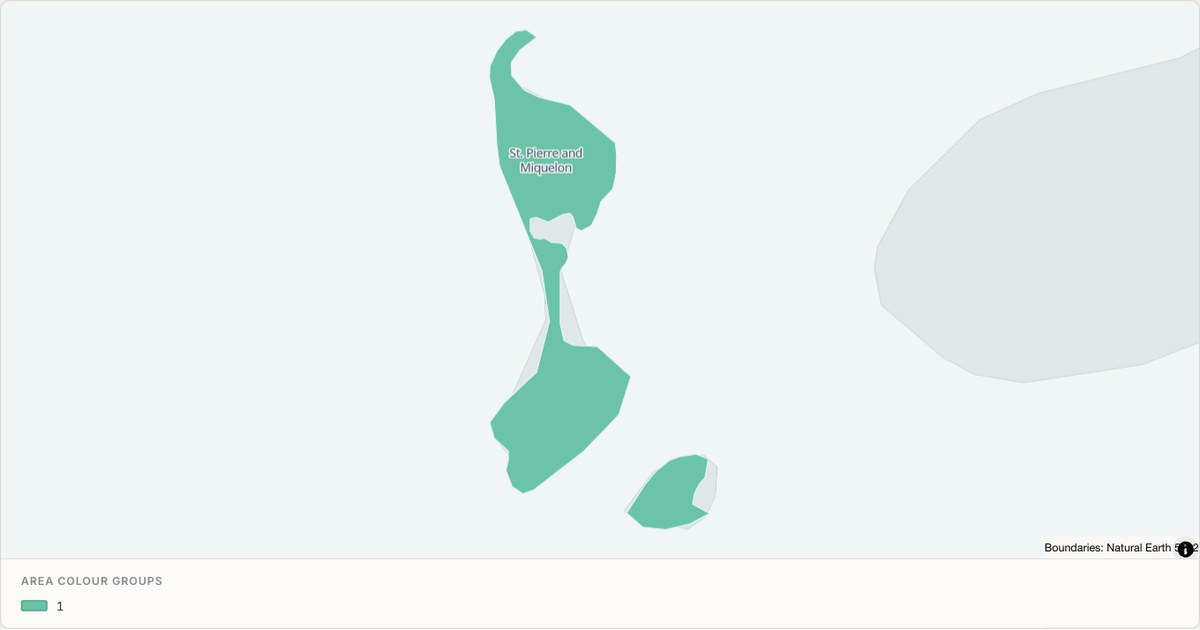 TopoJSONCategorical regions
Saint Pierre and Miquelon administrative map
Explore 2 named areas in Saint Pierre and Miquelon. Each boundary is selectable and carries a stable identifier, so you can add your own values or distinguish neighbouring areas with a categorical colour scheme.
Open map →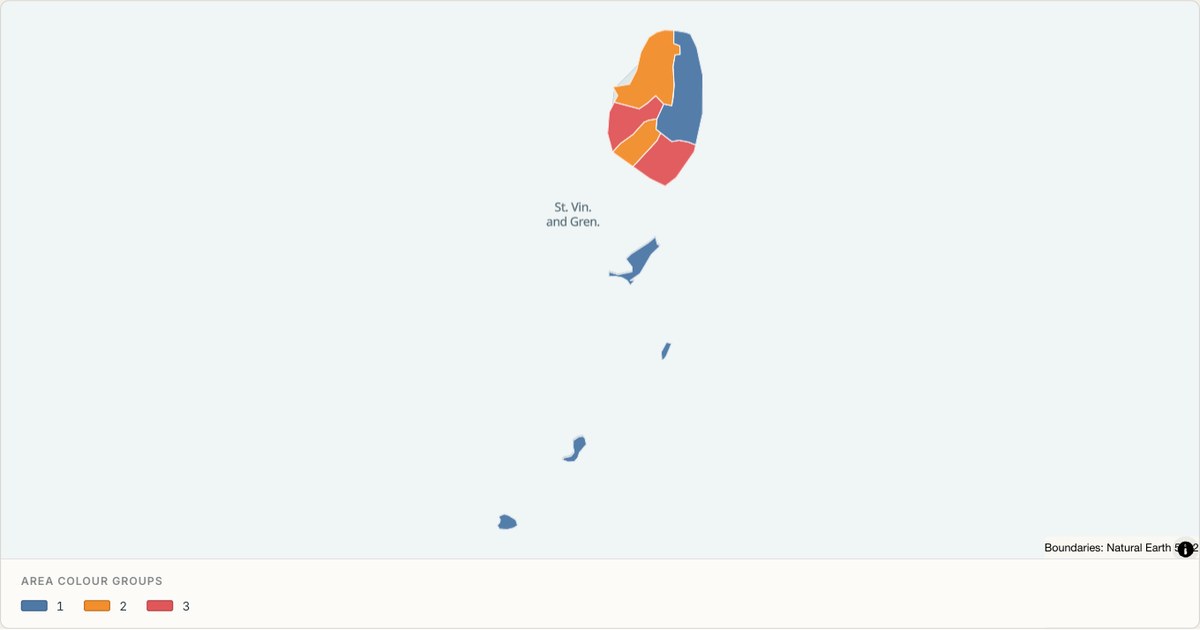 TopoJSONCategorical regions
Saint Vincent and the Grenadines administrative map
Explore 6 named areas in Saint Vincent and the Grenadines. Each boundary is selectable and carries a stable identifier, so you can add your own values or distinguish neighbouring areas with a categorical colour scheme.
Open map →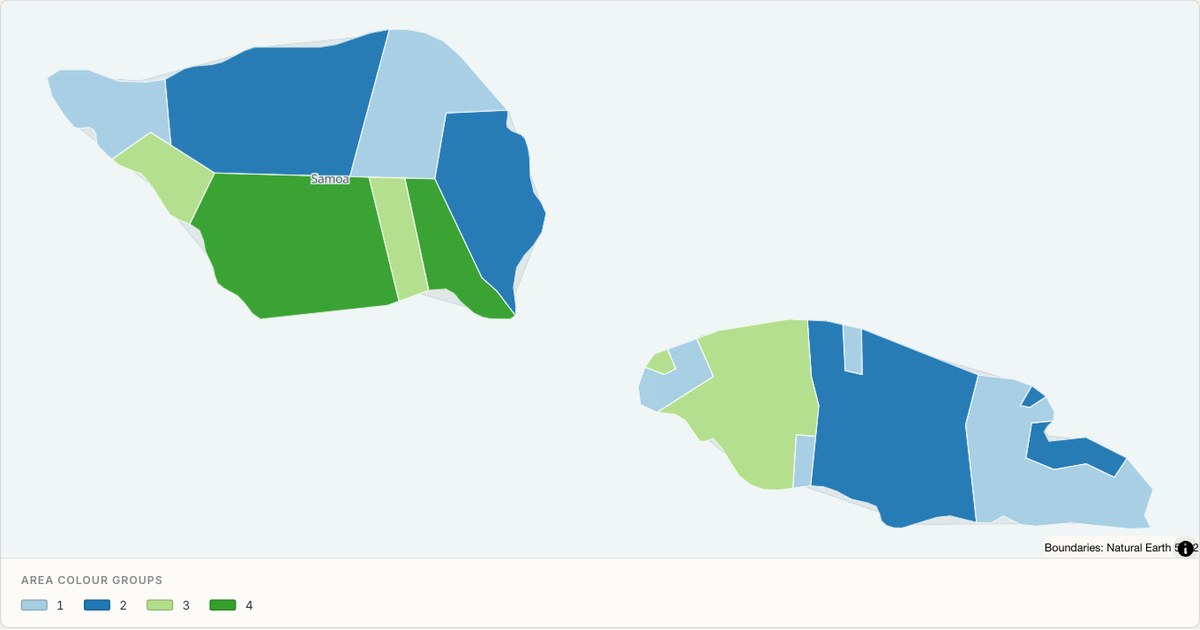 TopoJSONCategorical regions
Samoa administrative map
Explore 11 named areas in Samoa. Each boundary is selectable and carries a stable identifier, so you can add your own values or distinguish neighbouring areas with a categorical colour scheme.
Open map →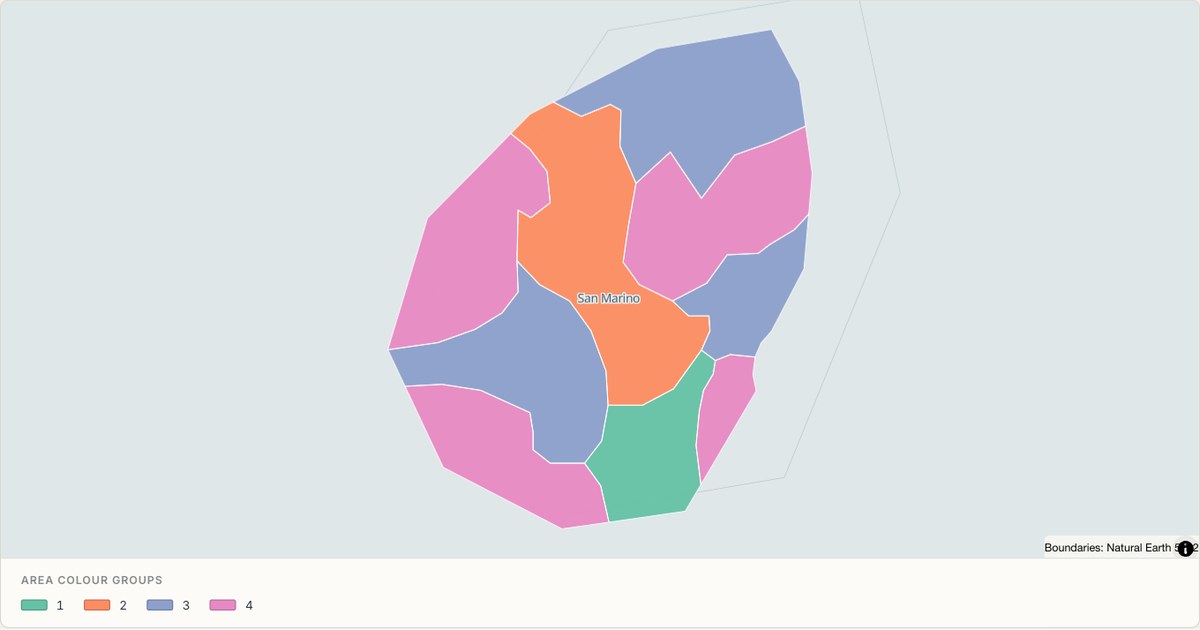 TopoJSONCategorical regions
San Marino administrative map
Explore 9 named areas in San Marino. Each boundary is selectable and carries a stable identifier, so you can add your own values or distinguish neighbouring areas with a categorical colour scheme.
Open map →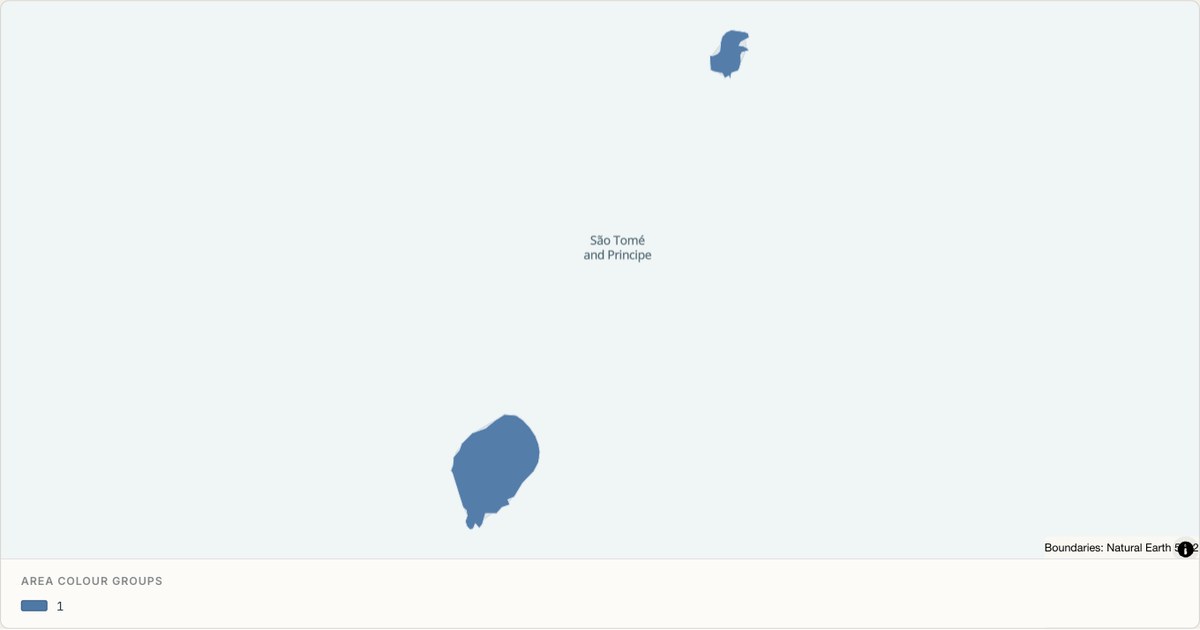 TopoJSONCategorical regions
Sao Tome and Principe administrative map
Explore 2 named areas in Sao Tome and Principe. Each boundary is selectable and carries a stable identifier, so you can add your own values or distinguish neighbouring areas with a categorical colour scheme.
Open map →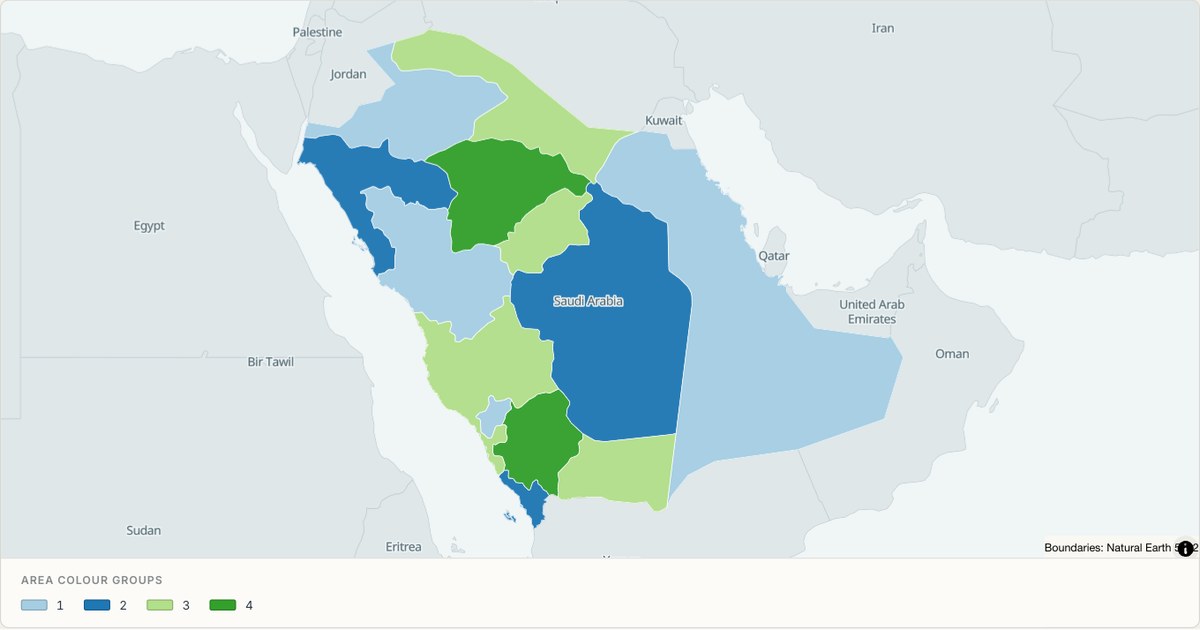 TopoJSONCategorical regions
Saudi Arabia administrative map
Explore 13 named areas in Saudi Arabia. Each boundary is selectable and carries a stable identifier, so you can add your own values or distinguish neighbouring areas with a categorical colour scheme.
Open map →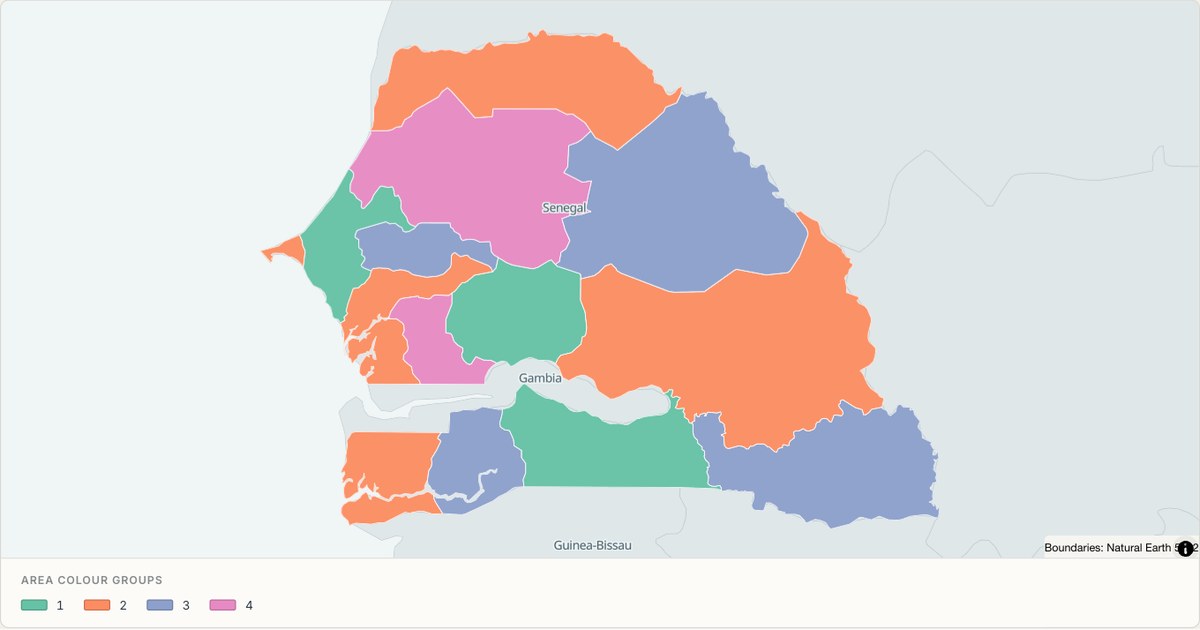 TopoJSONCategorical regions
Senegal administrative map
Explore 14 named areas in Senegal. Each boundary is selectable and carries a stable identifier, so you can add your own values or distinguish neighbouring areas with a categorical colour scheme.
Open map →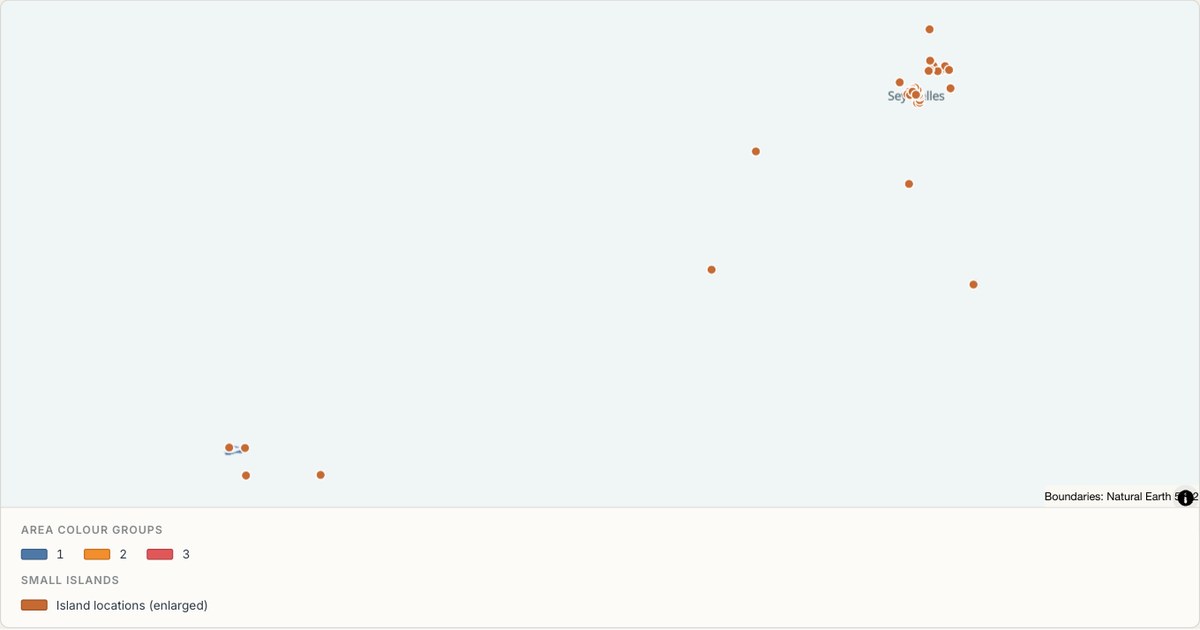 TopoJSONCategorical regions
Seychelles administrative map
Explore 26 named areas in Seychelles. Each boundary is selectable and carries a stable identifier, so you can add your own values or distinguish neighbouring areas with a categorical colour scheme.
Open map →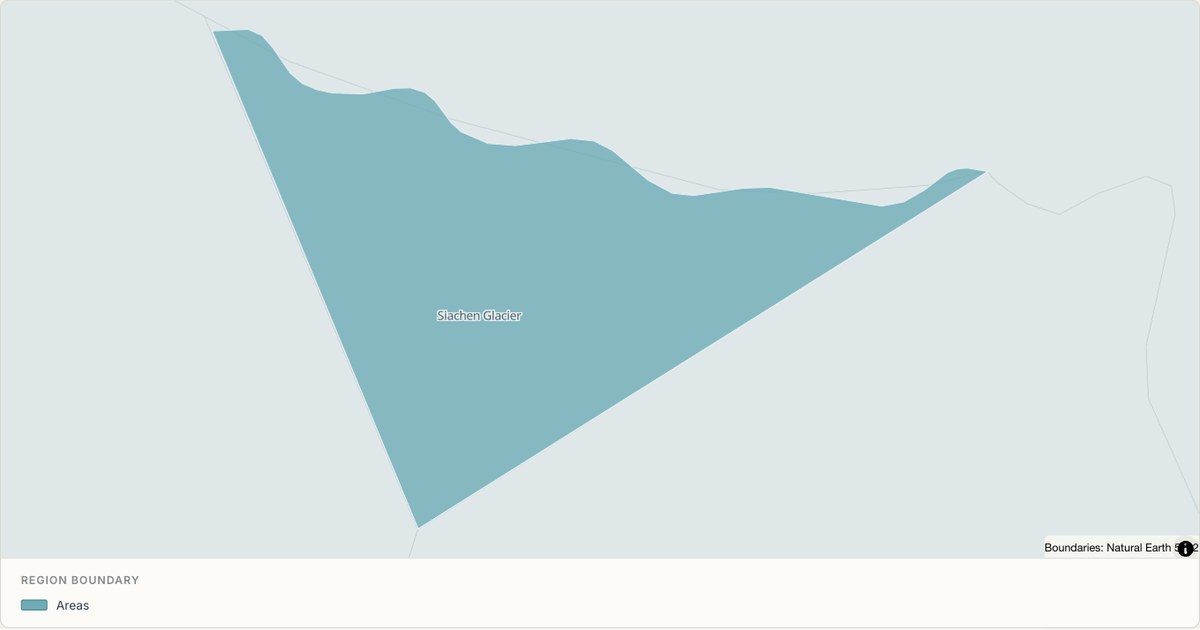 TopoJSONSingle boundary
Siachen Glacier boundary map
Explore the boundary supplied for Siachen Glacier. This snapshot contains one feature and does not provide internal subdivisions. Inspect its identifier and source attributes, or use it as a starting outline for your own map.
Open map →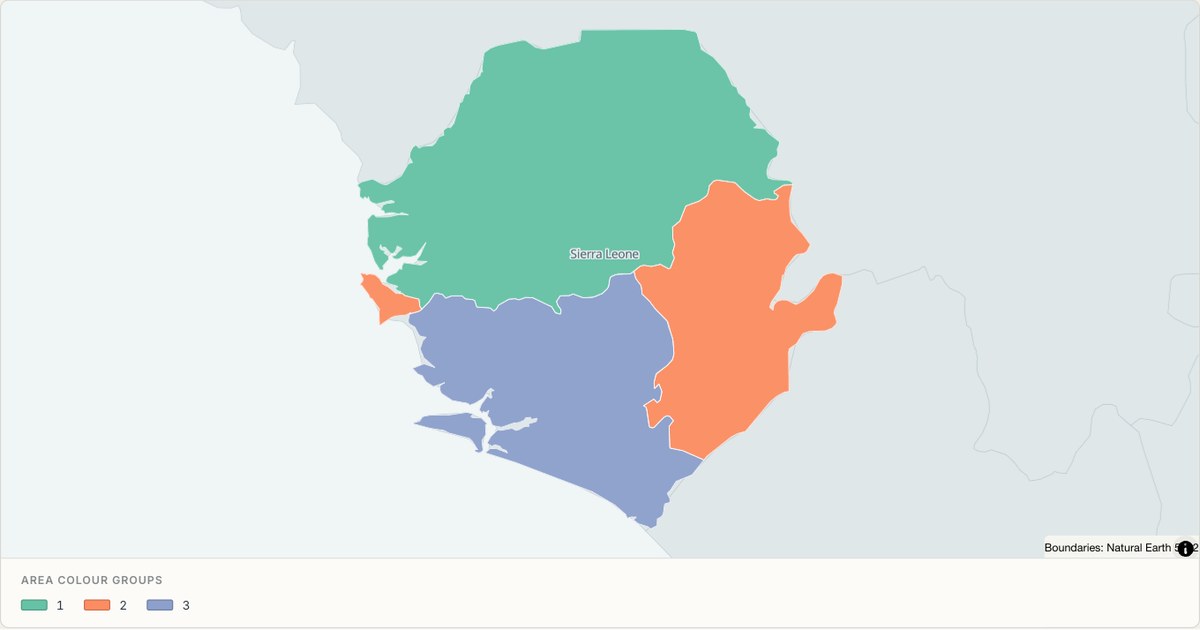 TopoJSONCategorical regions
Sierra Leone administrative map
Explore 4 named areas in Sierra Leone. Each boundary is selectable and carries a stable identifier, so you can add your own values or distinguish neighbouring areas with a categorical colour scheme.
Open map →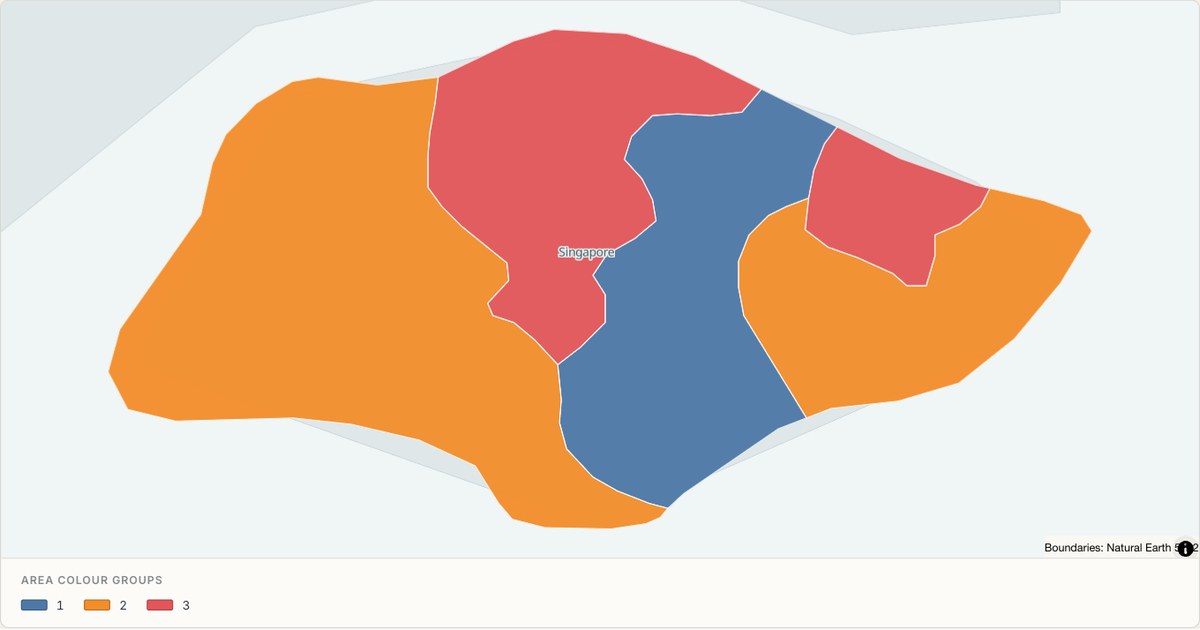 TopoJSONCategorical regions
Singapore administrative map
Explore 5 named areas in Singapore. Each boundary is selectable and carries a stable identifier, so you can add your own values or distinguish neighbouring areas with a categorical colour scheme.
Open map → TopoJSONSingle boundary
Sint Maarten boundary map
Explore the boundary supplied for Sint Maarten. This snapshot contains one feature and does not provide internal subdivisions. Inspect its identifier and source attributes, or use it as a starting outline for your own map.
Open map →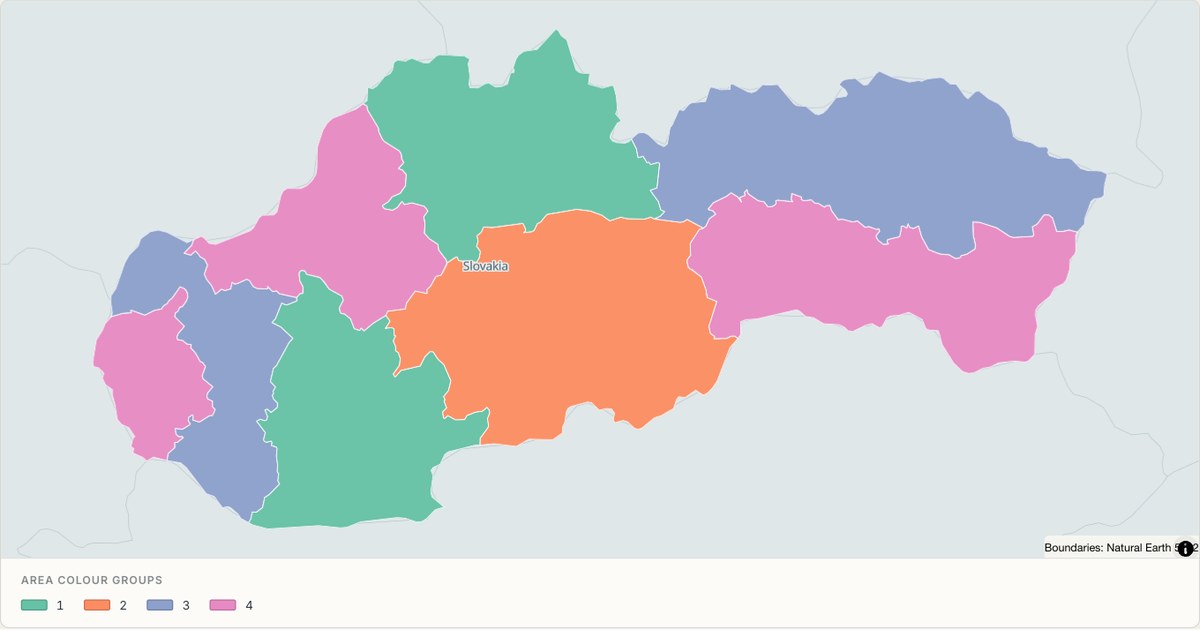 TopoJSONCategorical regions
Slovakia administrative map
Explore 8 named areas in Slovakia. Each boundary is selectable and carries a stable identifier, so you can add your own values or distinguish neighbouring areas with a categorical colour scheme.
Open map →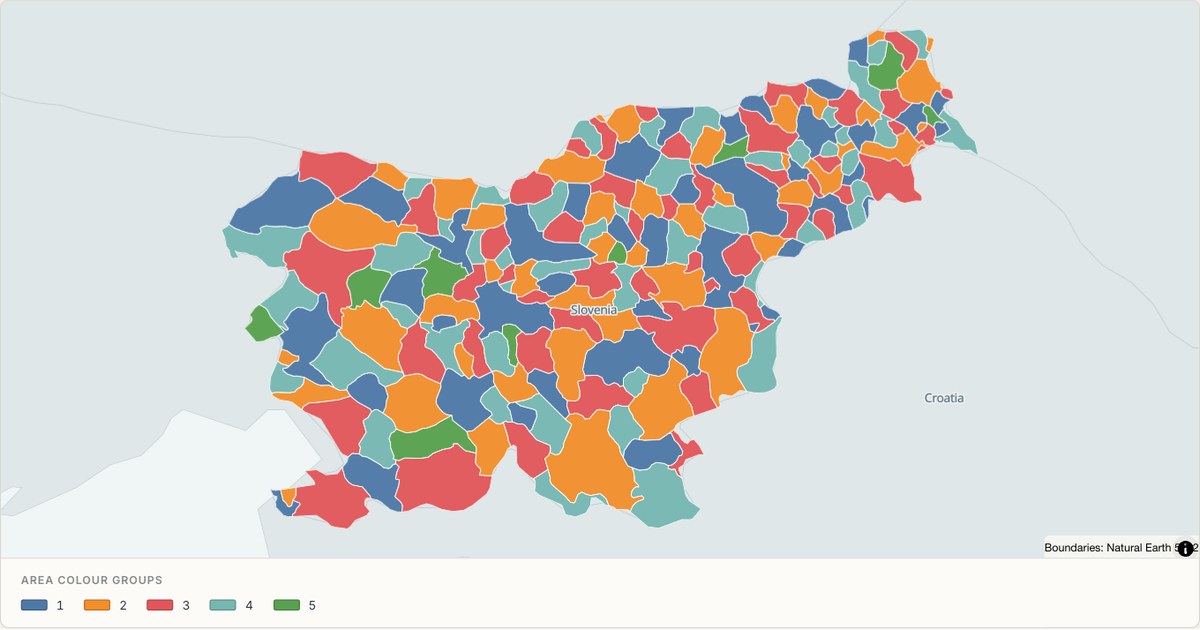 TopoJSONCategorical regions
Slovenia administrative map
Explore 193 named areas in Slovenia. Each boundary is selectable and carries a stable identifier, so you can add your own values or distinguish neighbouring areas with a categorical colour scheme.
Open map →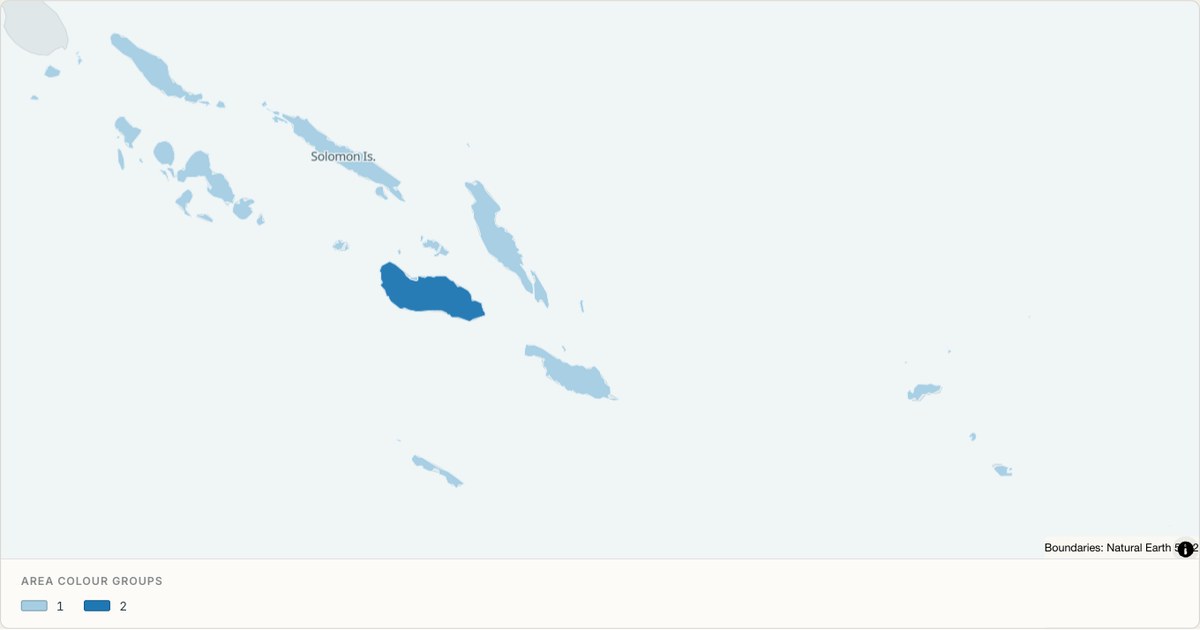 TopoJSONCategorical regions
Solomon Islands administrative map
Explore 10 named areas in Solomon Islands. Each boundary is selectable and carries a stable identifier, so you can add your own values or distinguish neighbouring areas with a categorical colour scheme.
Open map →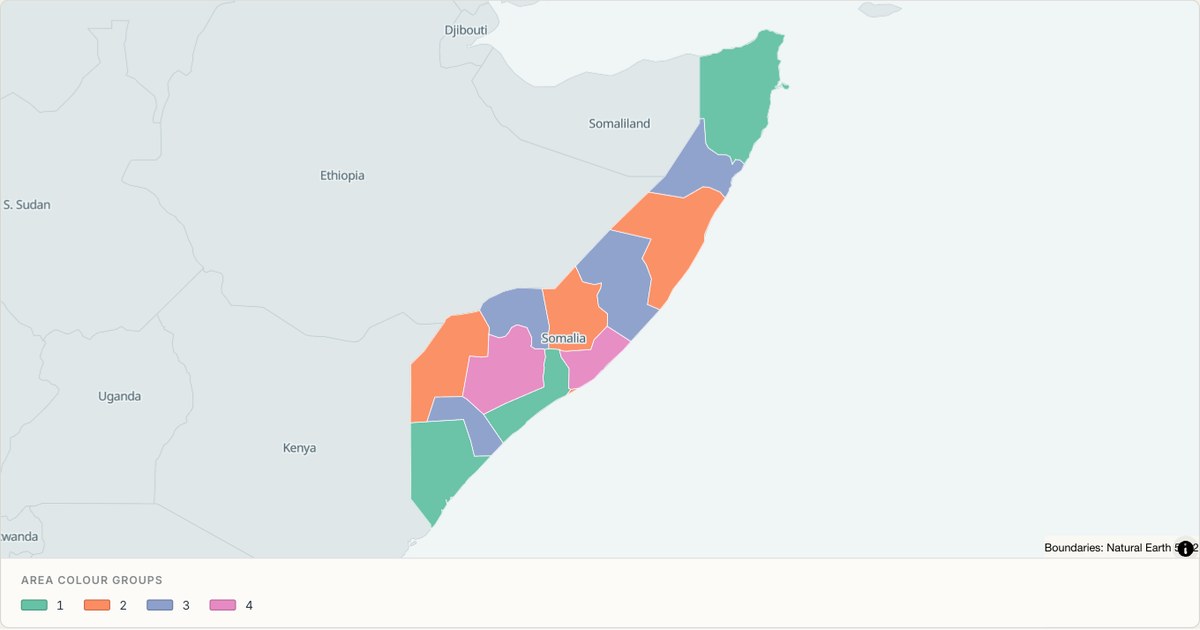 TopoJSONCategorical regions
Somalia administrative map
Explore 13 named areas in Somalia. Each boundary is selectable and carries a stable identifier, so you can add your own values or distinguish neighbouring areas with a categorical colour scheme.
Open map →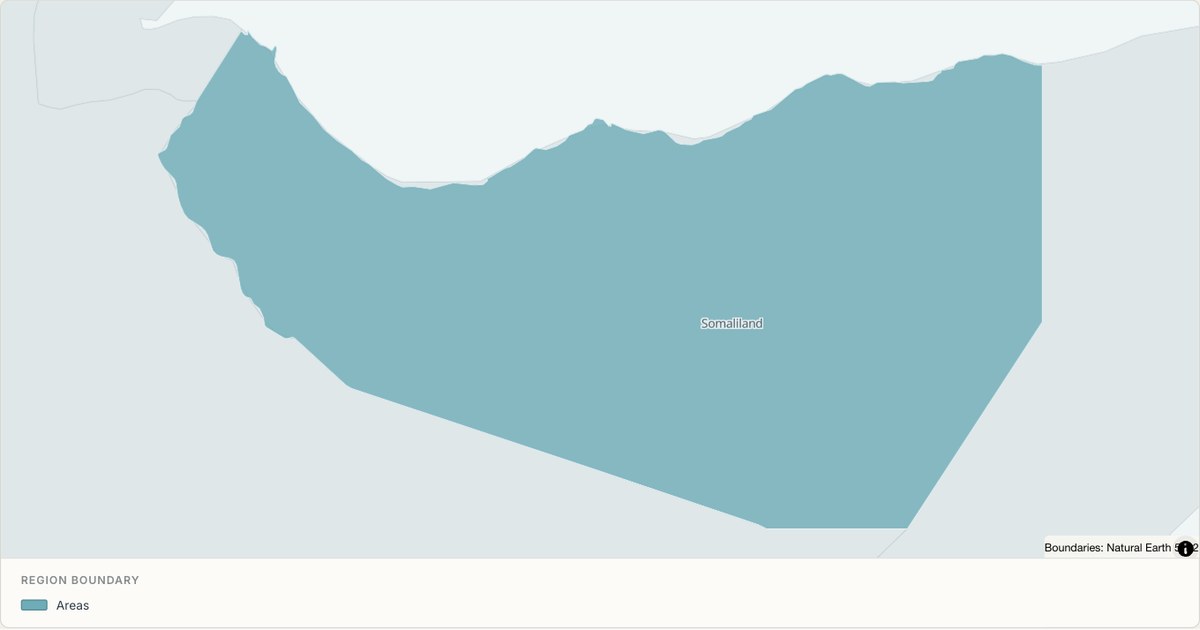 TopoJSONSingle boundary
Somaliland boundary map
Explore the boundary supplied for Somaliland. This snapshot contains one feature and does not provide internal subdivisions. Inspect its identifier and source attributes, or use it as a starting outline for your own map.
Open map →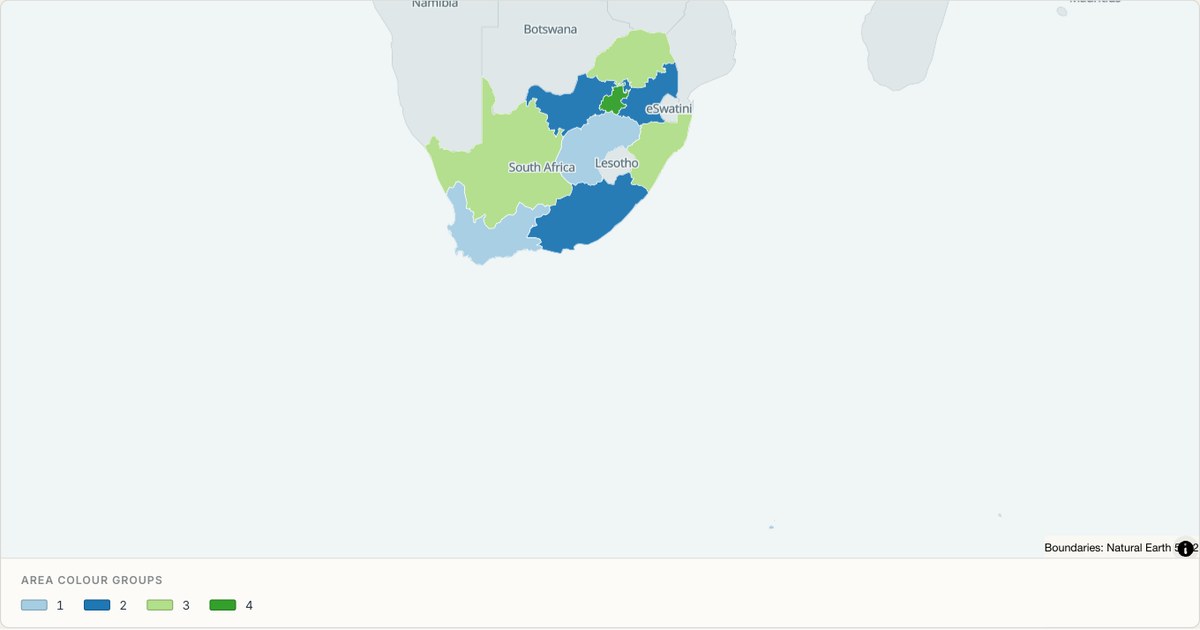 TopoJSONCategorical regions
South Africa administrative map
Explore 9 named areas in South Africa. Each boundary is selectable and carries a stable identifier, so you can add your own values or distinguish neighbouring areas with a categorical colour scheme.
Open map →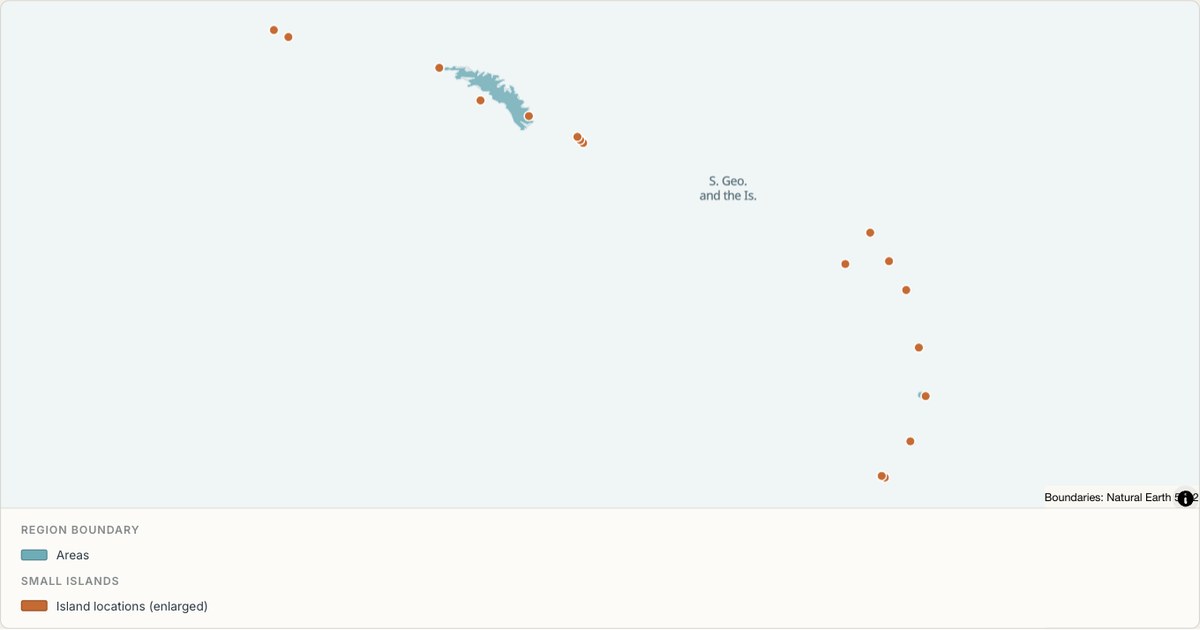 TopoJSONSingle boundary
South Georgia and the Islands boundary map
Explore the boundary supplied for South Georgia and the Islands. This snapshot contains one feature and does not provide internal subdivisions. Inspect its identifier and source attributes, or use it as a starting outline for your own map.
Open map →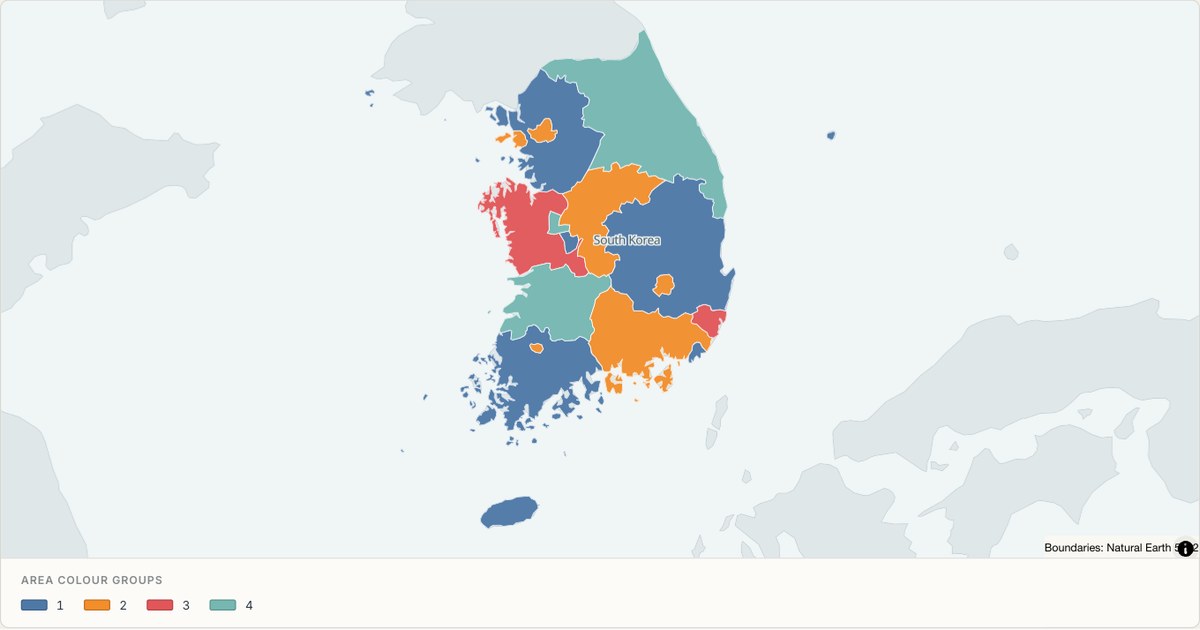 TopoJSONCategorical regions
South Korea administrative map
Explore 17 named areas in South Korea. Each boundary is selectable and carries a stable identifier, so you can add your own values or distinguish neighbouring areas with a categorical colour scheme.
Open map →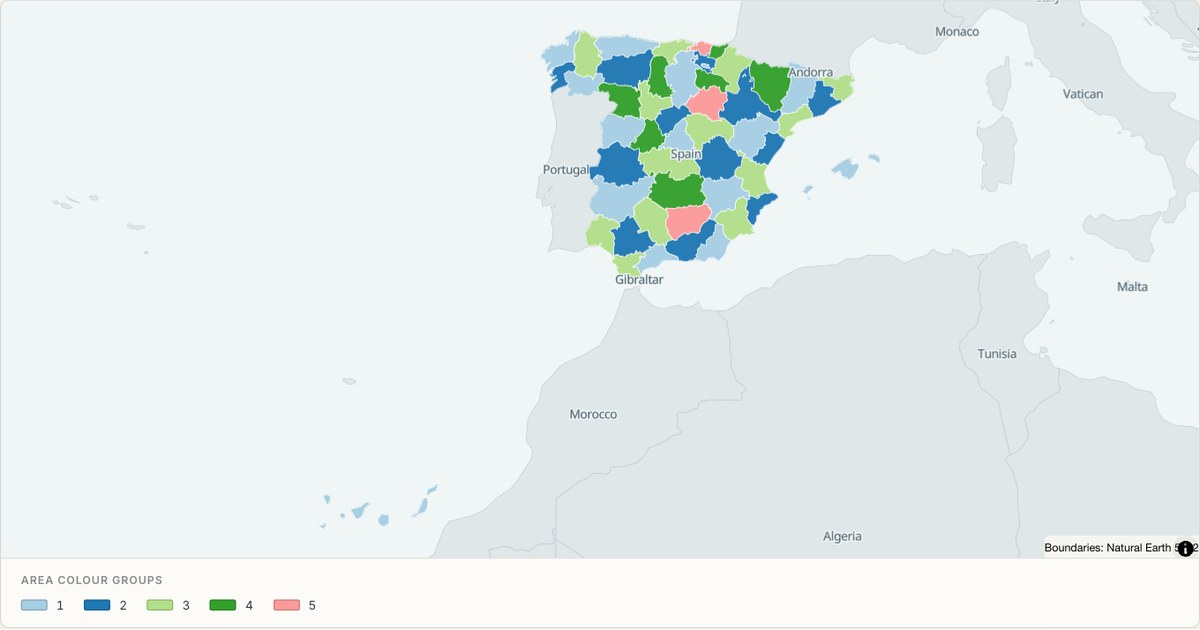 TopoJSONCategorical regions
Spain administrative map
Explore 52 named areas in Spain. Each boundary is selectable and carries a stable identifier, so you can add your own values or distinguish neighbouring areas with a categorical colour scheme.
Open map →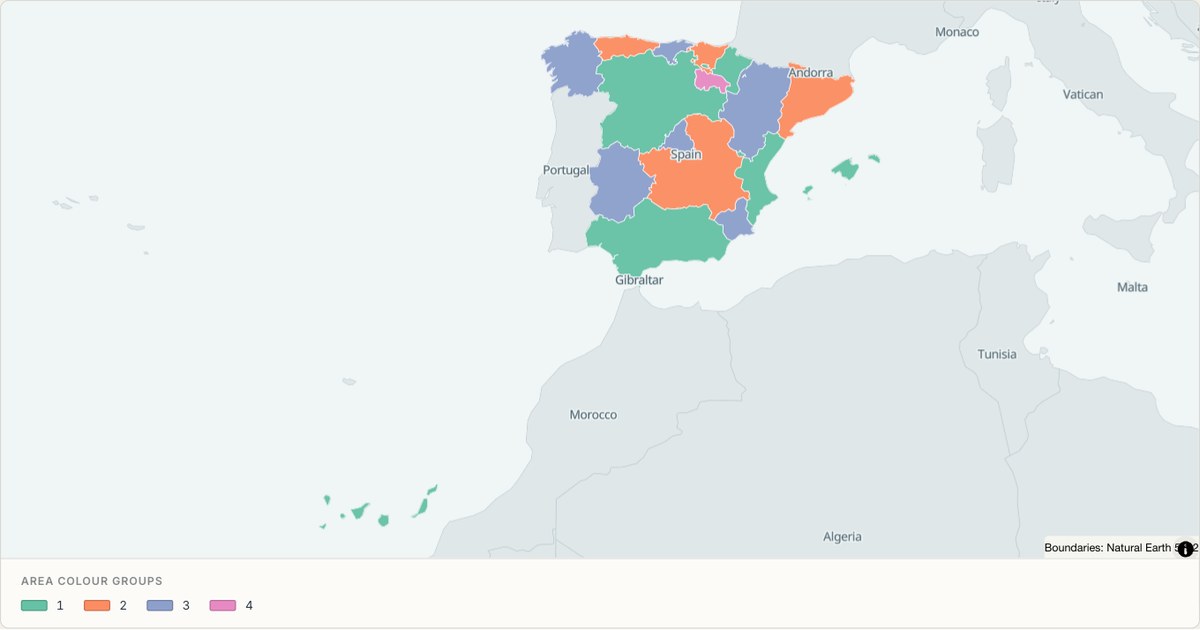 TopoJSONCategorical regions
Spain (autonomous communities) administrative map
Explore 19 named areas in Spain (autonomous communities). Each boundary is selectable and carries a stable identifier, so you can add your own values or distinguish neighbouring areas with a categorical colour scheme.
Open map →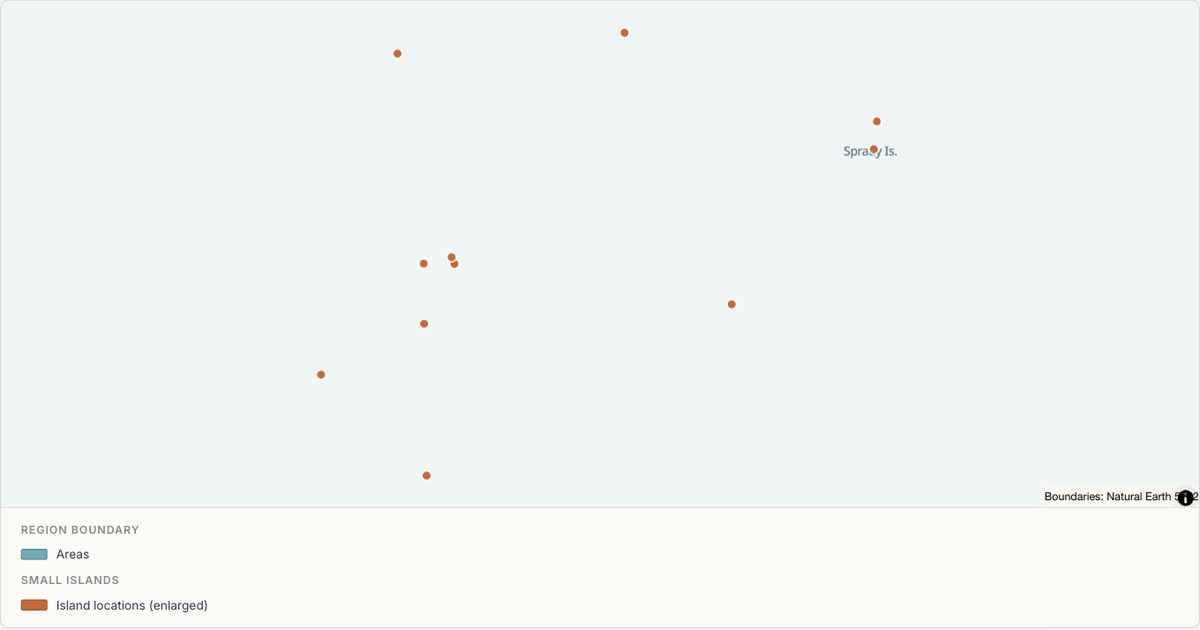 TopoJSONSingle boundary
Spratly Is. boundary map
Explore the boundary supplied for Spratly Is.. This snapshot contains one feature and does not provide internal subdivisions. Inspect its identifier and source attributes, or use it as a starting outline for your own map.
Open map →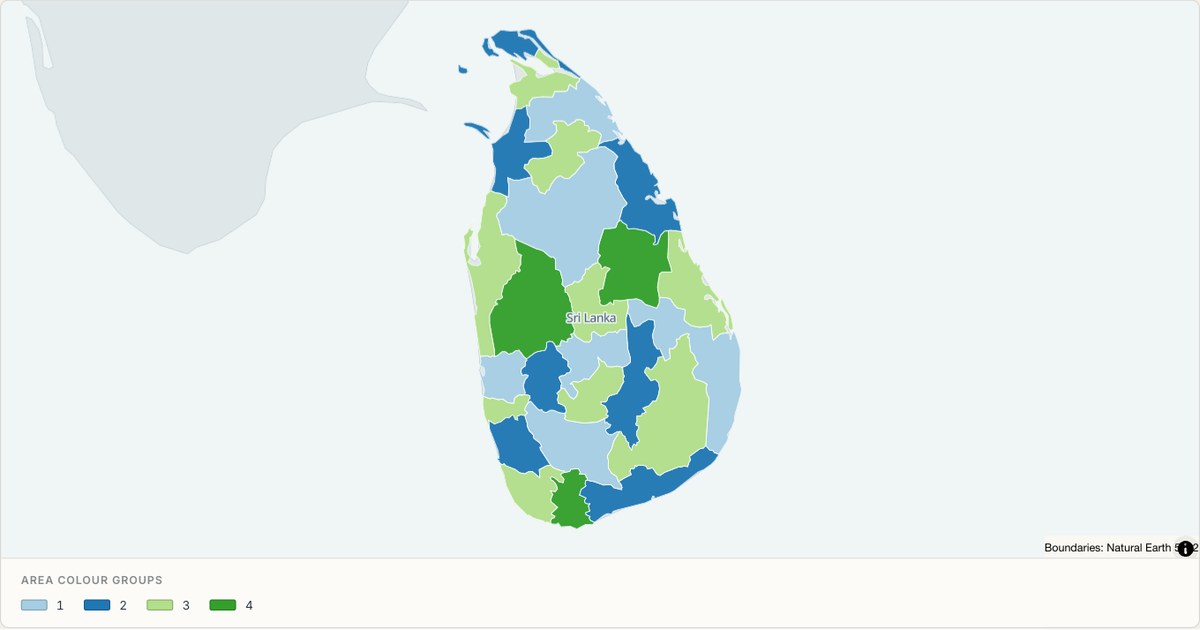 TopoJSONCategorical regions
Sri Lanka administrative map
Explore 25 named areas in Sri Lanka. Each boundary is selectable and carries a stable identifier, so you can add your own values or distinguish neighbouring areas with a categorical colour scheme.
Open map →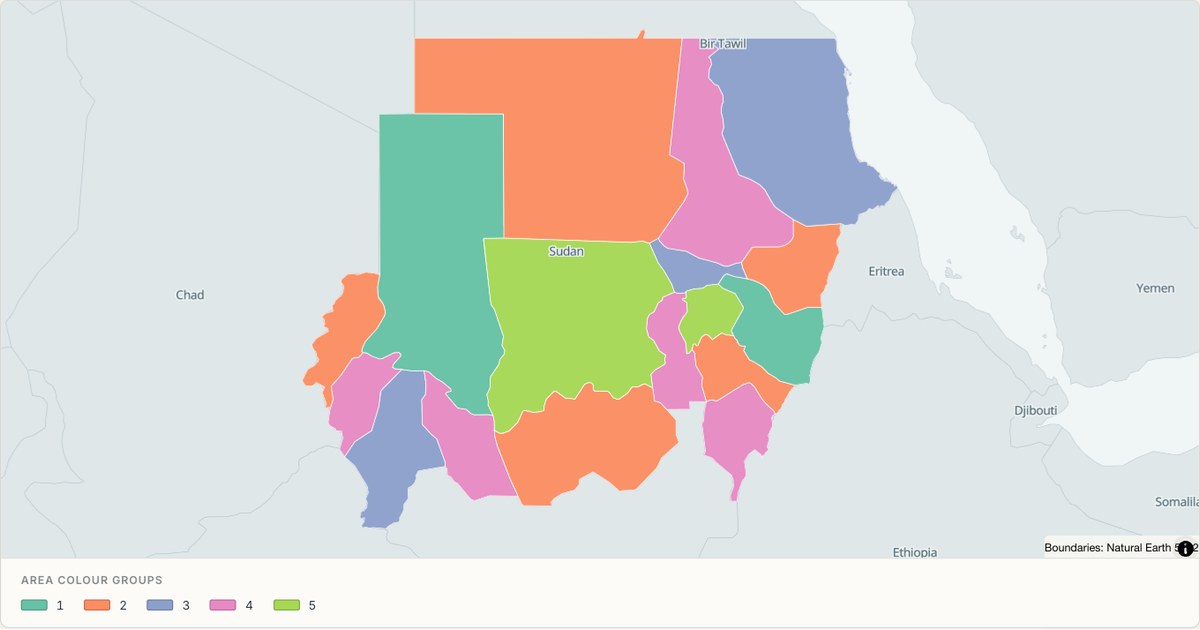 TopoJSONCategorical regions
Sudan administrative map
Explore 17 named areas in Sudan. Each boundary is selectable and carries a stable identifier, so you can add your own values or distinguish neighbouring areas with a categorical colour scheme.
Open map →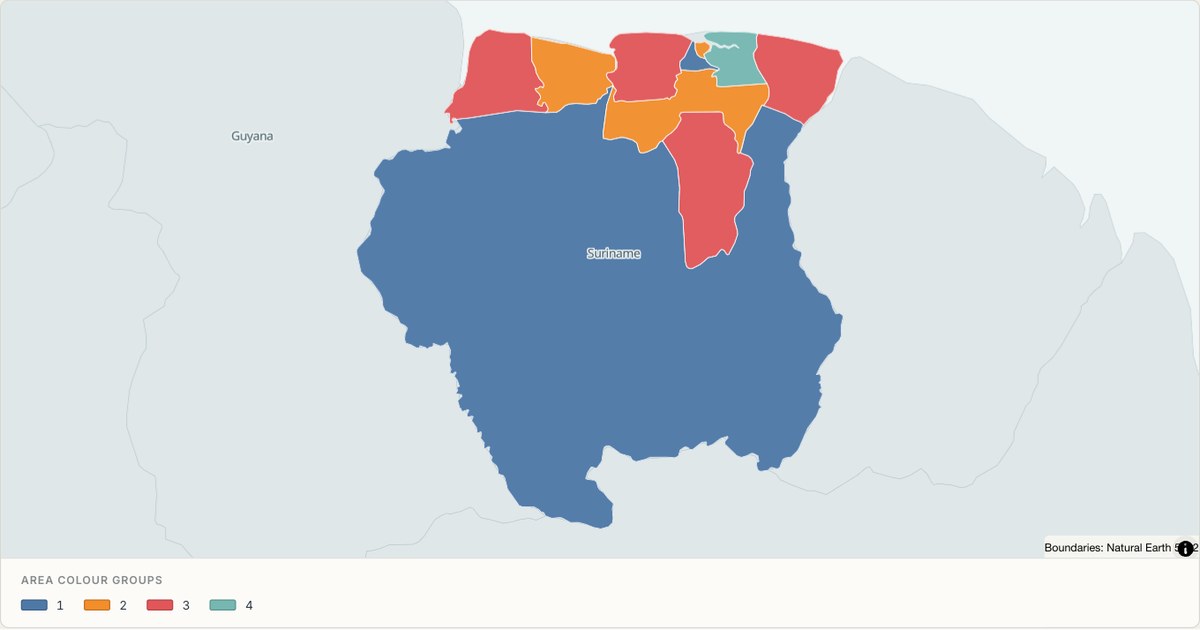 TopoJSONCategorical regions
Suriname administrative map
Explore 10 named areas in Suriname. Each boundary is selectable and carries a stable identifier, so you can add your own values or distinguish neighbouring areas with a categorical colour scheme.
Open map →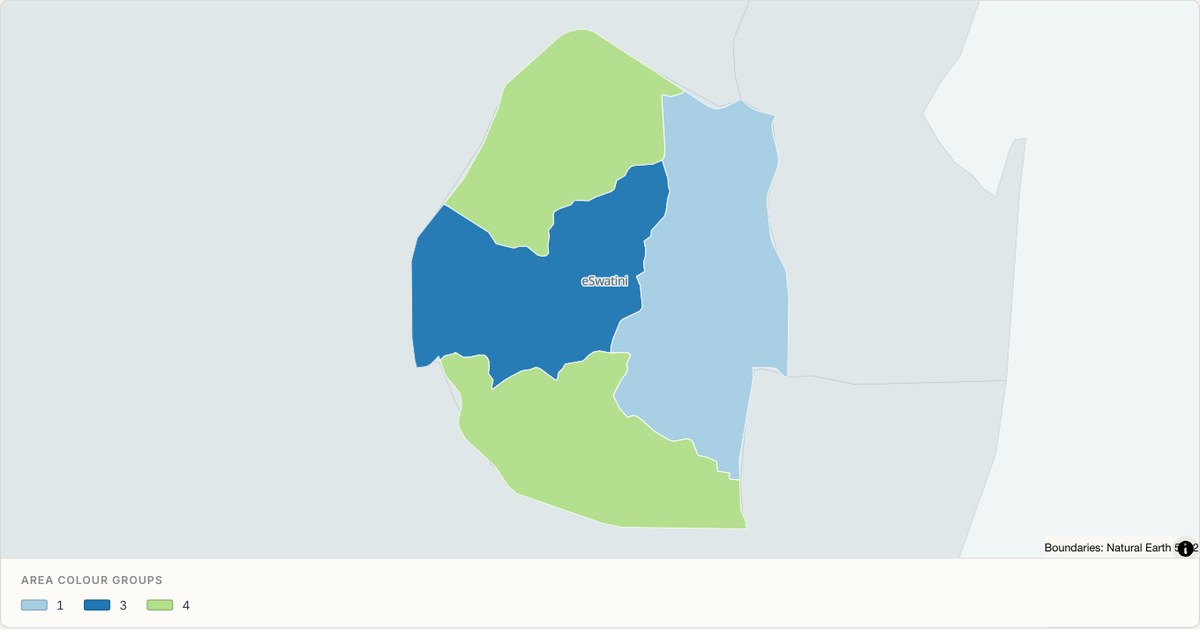 TopoJSONCategorical regions
Swaziland administrative map
Explore 4 named areas in Swaziland. Each boundary is selectable and carries a stable identifier, so you can add your own values or distinguish neighbouring areas with a categorical colour scheme.
Open map →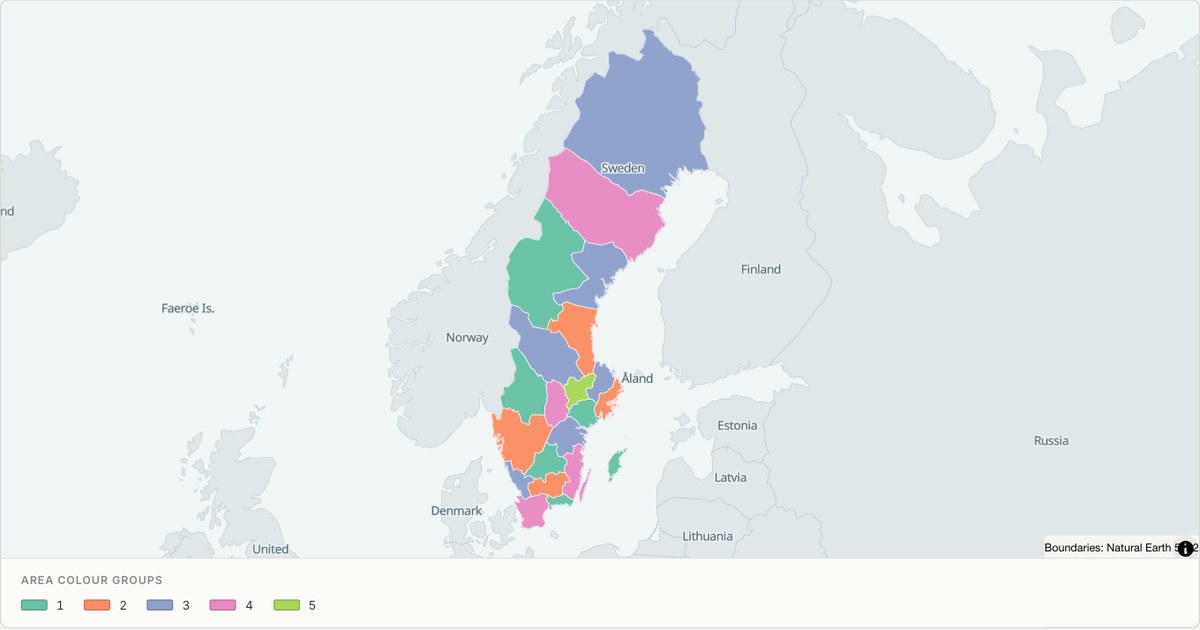 TopoJSONCategorical regions
Sweden administrative map
Explore 21 named areas in Sweden. Each boundary is selectable and carries a stable identifier, so you can add your own values or distinguish neighbouring areas with a categorical colour scheme.
Open map →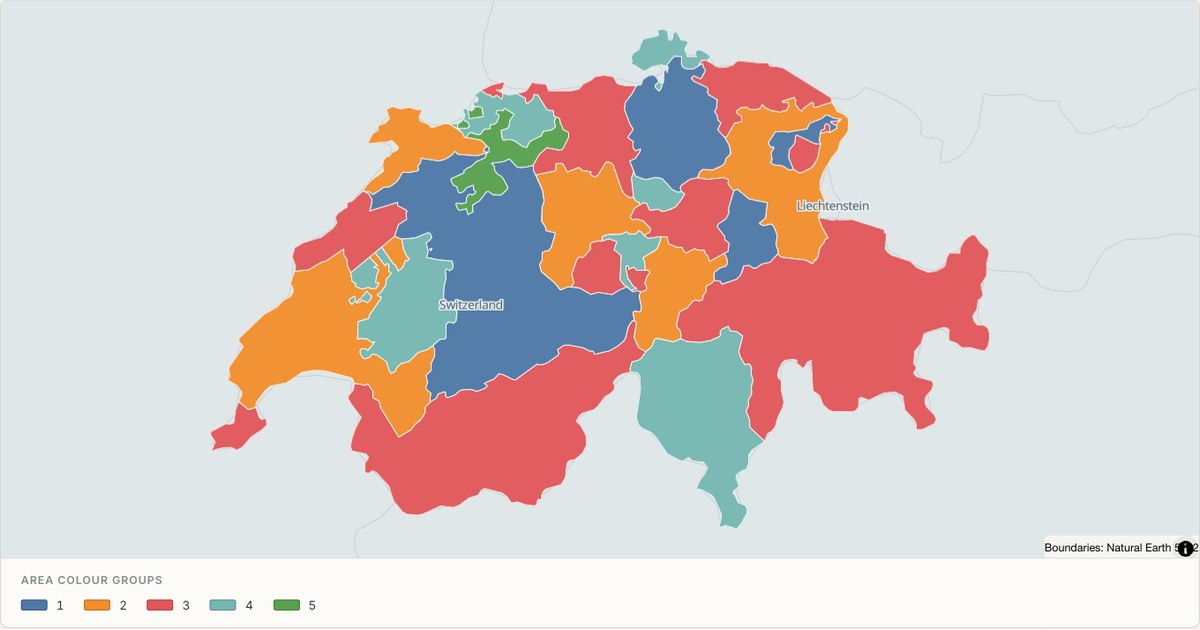 TopoJSONCategorical regions
Switzerland administrative map
Explore 26 named areas in Switzerland. Each boundary is selectable and carries a stable identifier, so you can add your own values or distinguish neighbouring areas with a categorical colour scheme.
Open map →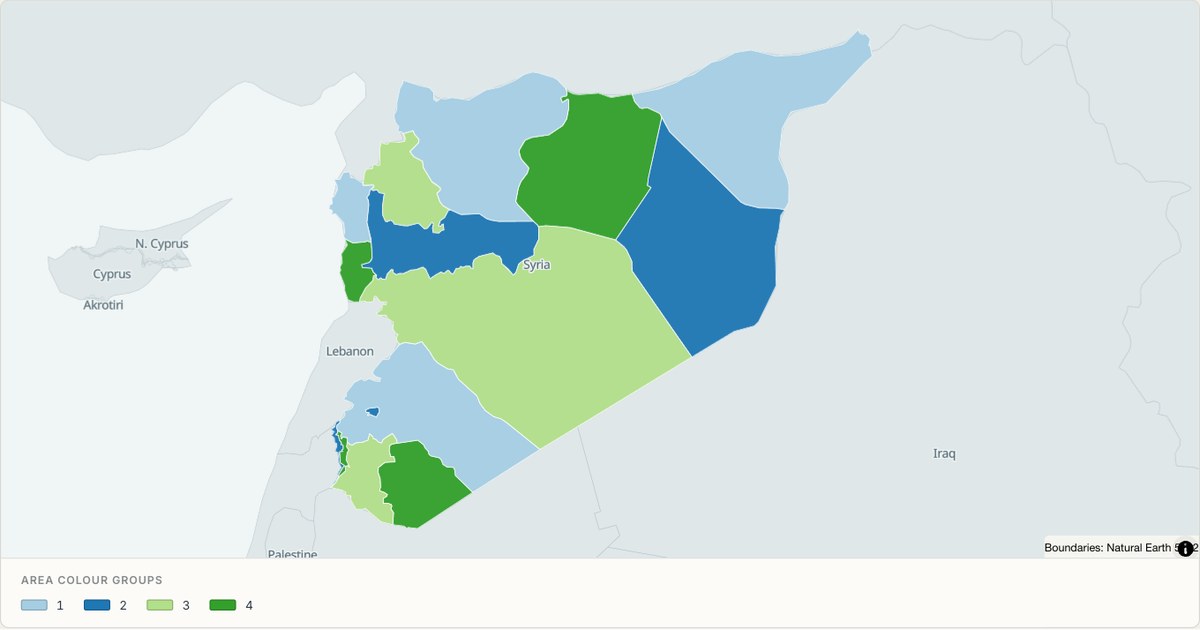 TopoJSONCategorical regions
Syria administrative map
Explore 15 named areas in Syria. Each boundary is selectable and carries a stable identifier, so you can add your own values or distinguish neighbouring areas with a categorical colour scheme.
Open map →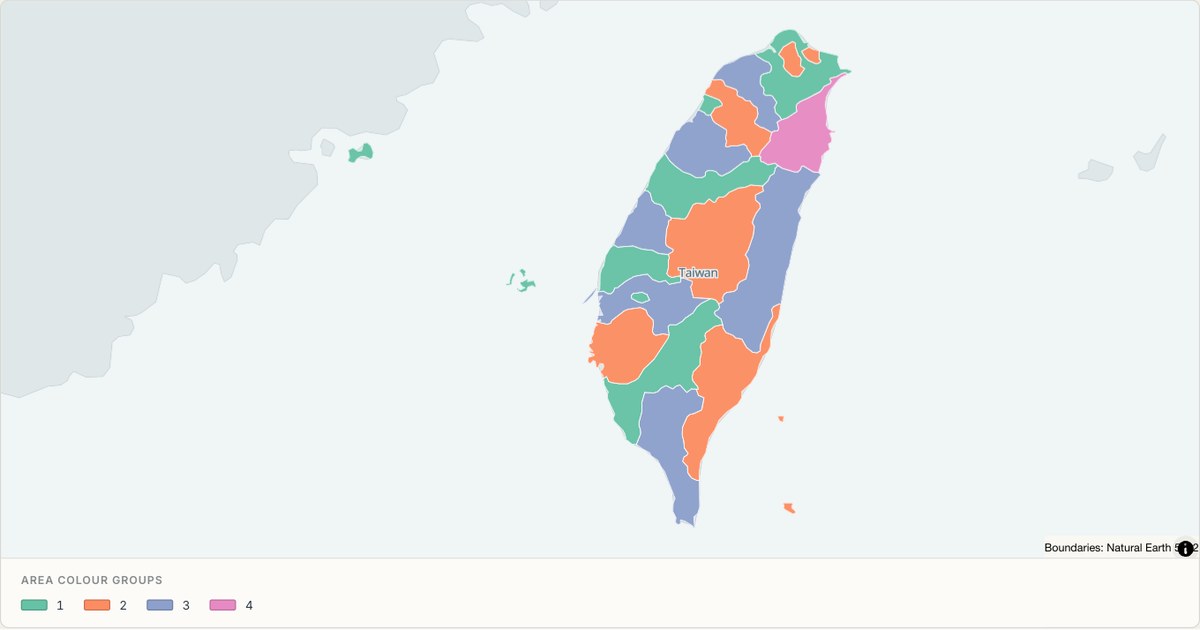 TopoJSONCategorical regions
Taiwan administrative map
Explore 21 named areas in Taiwan. Each boundary is selectable and carries a stable identifier, so you can add your own values or distinguish neighbouring areas with a categorical colour scheme.
Open map →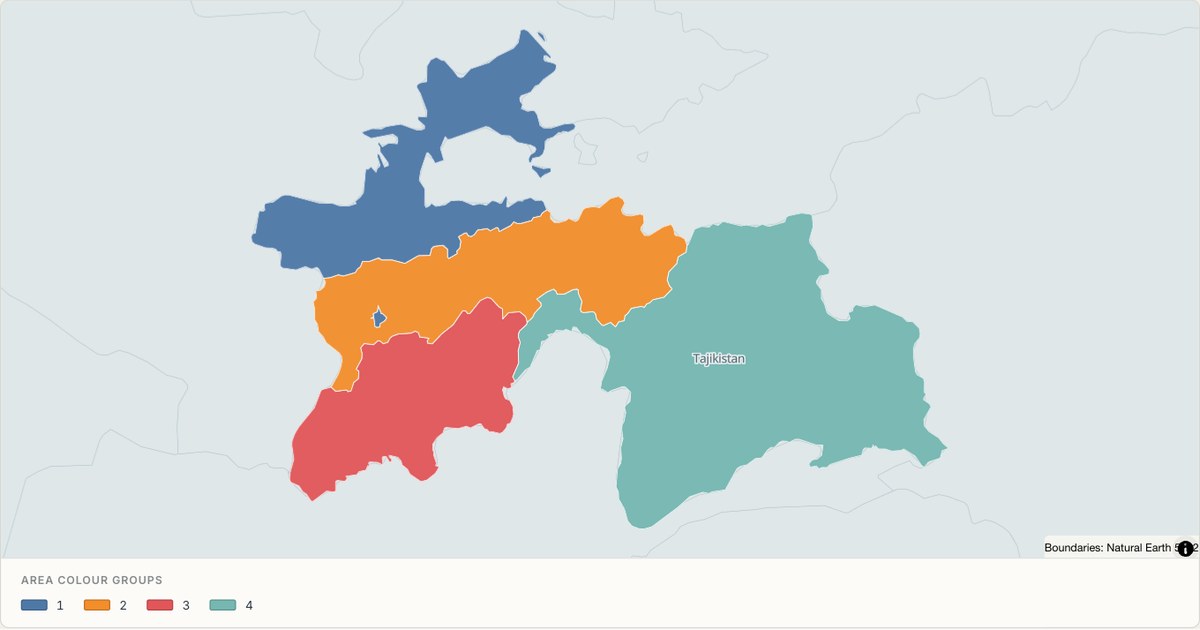 TopoJSONCategorical regions
Tajikistan administrative map
Explore 5 named areas in Tajikistan. Each boundary is selectable and carries a stable identifier, so you can add your own values or distinguish neighbouring areas with a categorical colour scheme.
Open map →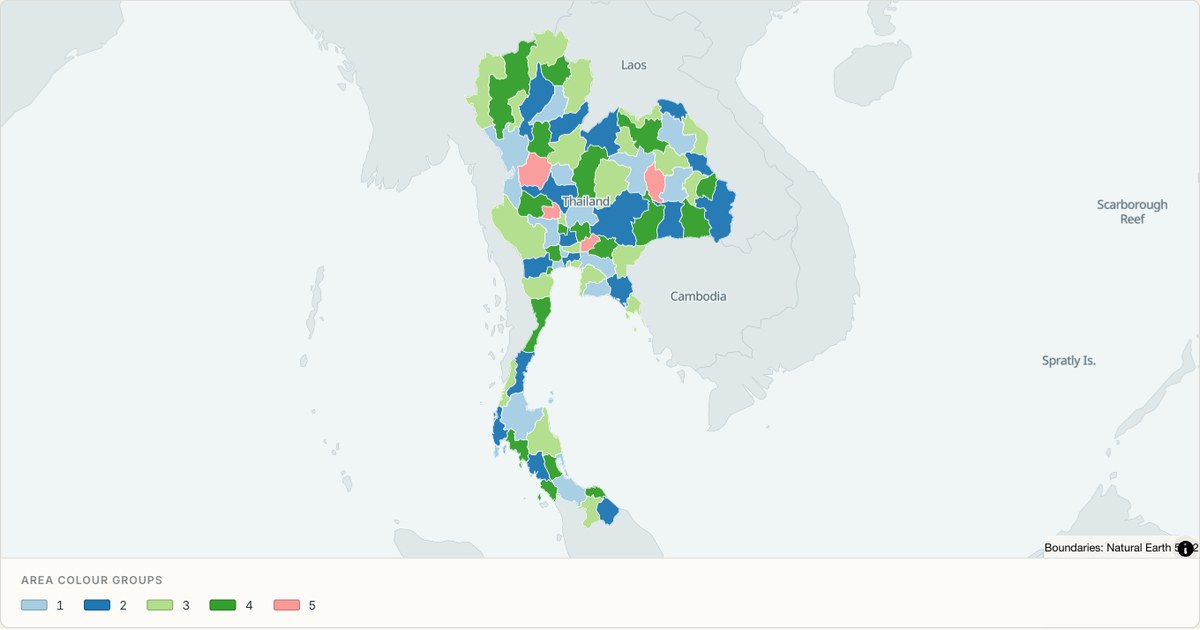 TopoJSONCategorical regions
Thailand administrative map
Explore 77 named areas in Thailand. Each boundary is selectable and carries a stable identifier, so you can add your own values or distinguish neighbouring areas with a categorical colour scheme.
Open map →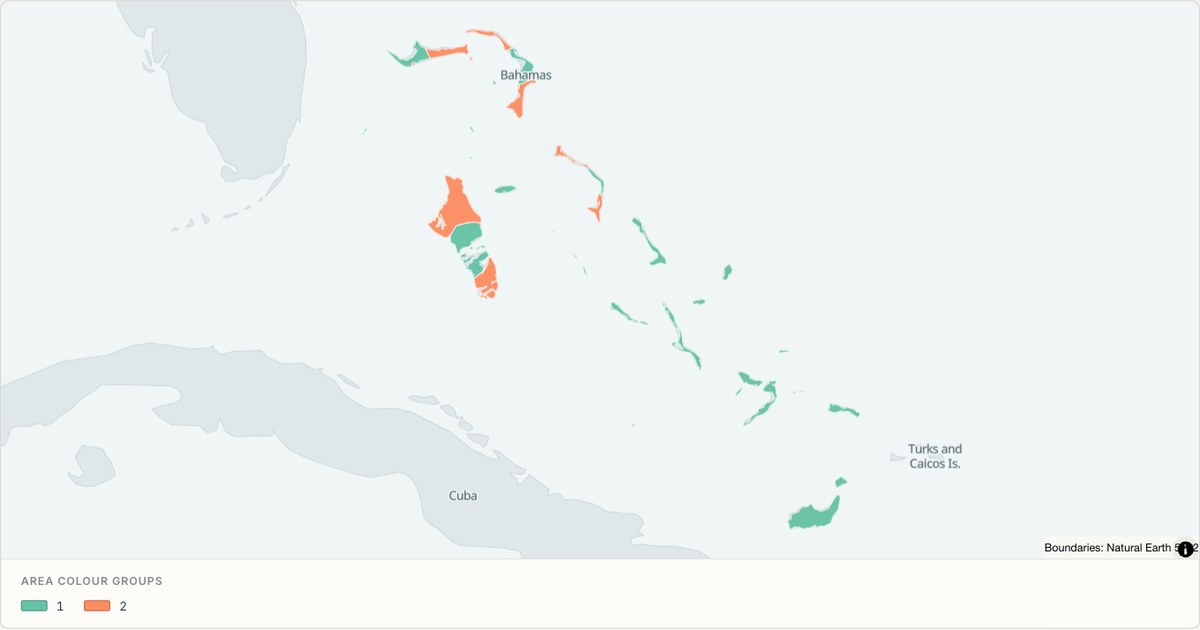 TopoJSONCategorical regions
The Bahamas administrative map
Explore 30 named areas in The Bahamas. Each boundary is selectable and carries a stable identifier, so you can add your own values or distinguish neighbouring areas with a categorical colour scheme.
Open map →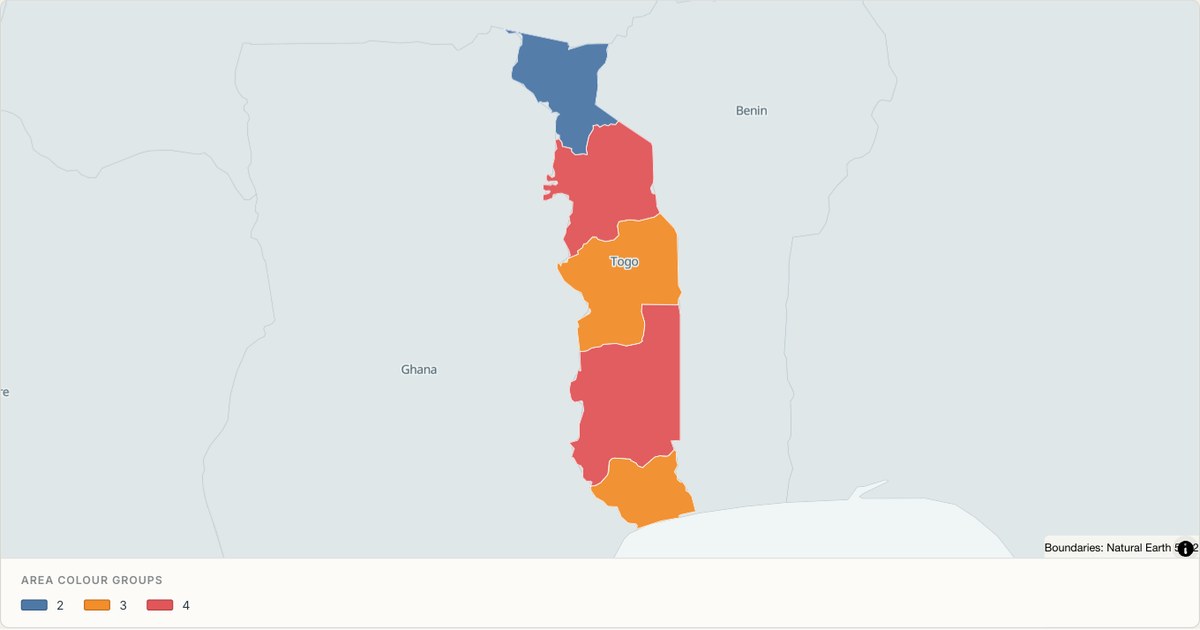 TopoJSONCategorical regions
Togo administrative map
Explore 5 named areas in Togo. Each boundary is selectable and carries a stable identifier, so you can add your own values or distinguish neighbouring areas with a categorical colour scheme.
Open map →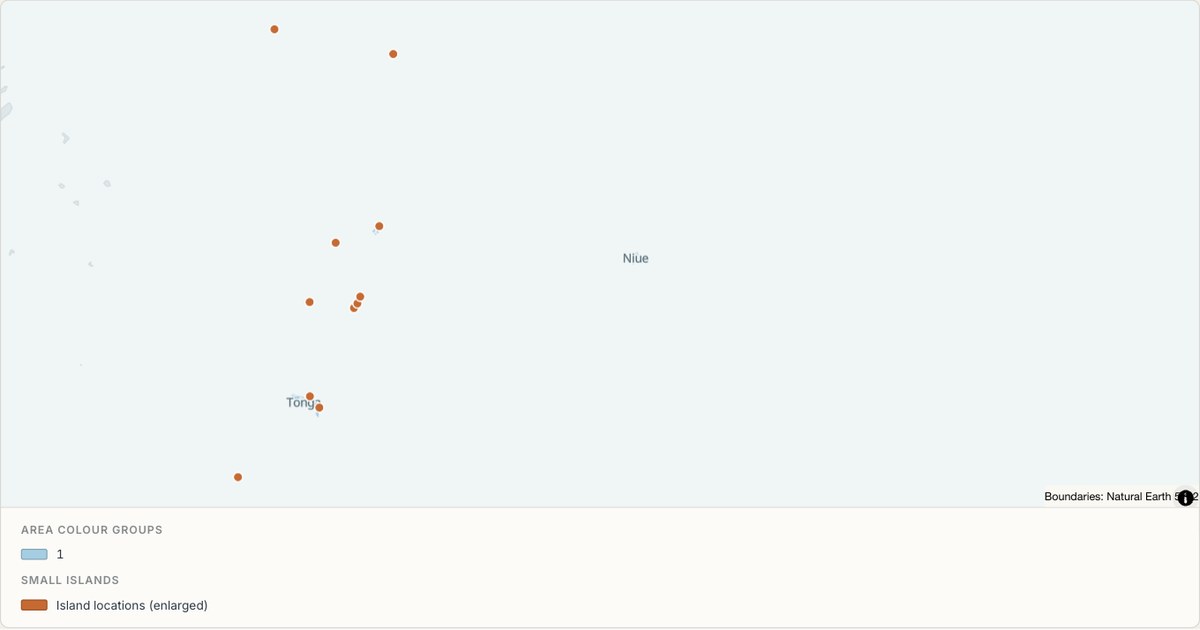 TopoJSONCategorical regions
Tonga administrative map
Explore 5 named areas in Tonga. Each boundary is selectable and carries a stable identifier, so you can add your own values or distinguish neighbouring areas with a categorical colour scheme.
Open map →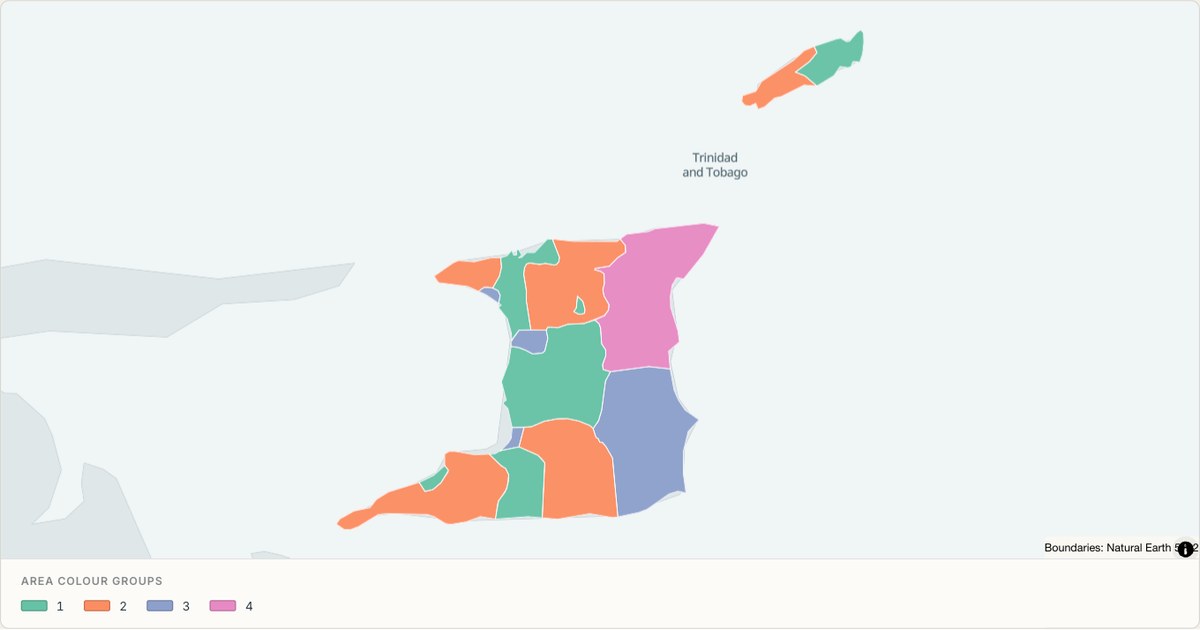 TopoJSONCategorical regions
Trinidad and Tobago administrative map
Explore 16 named areas in Trinidad and Tobago. Each boundary is selectable and carries a stable identifier, so you can add your own values or distinguish neighbouring areas with a categorical colour scheme.
Open map →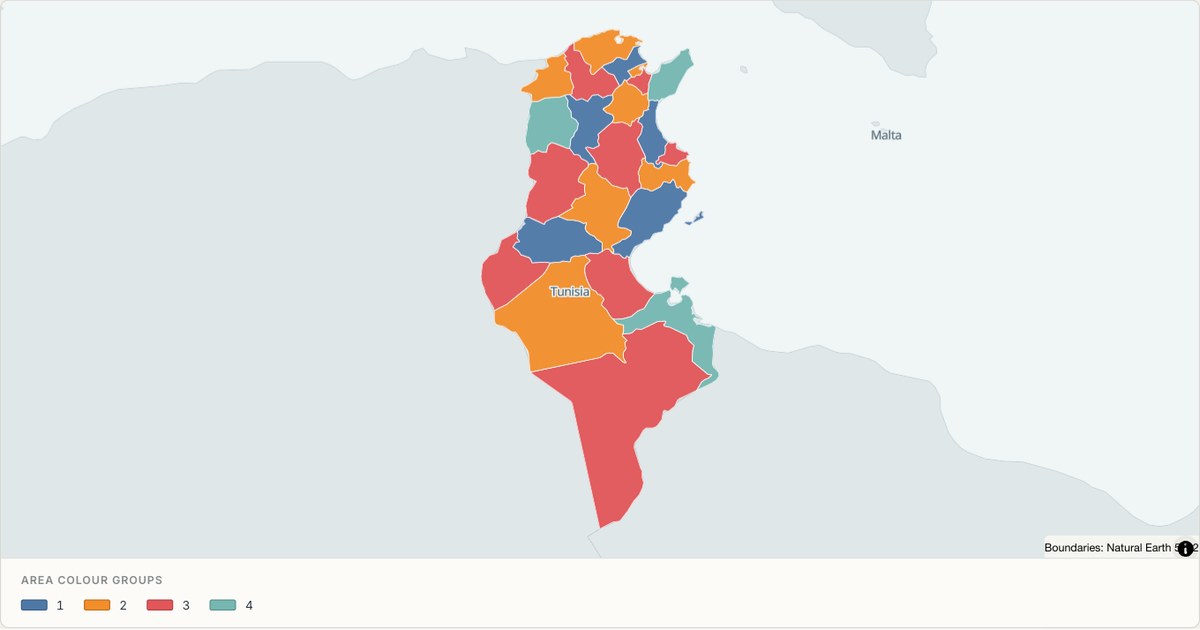 TopoJSONCategorical regions
Tunisia administrative map
Explore 23 named areas in Tunisia. Each boundary is selectable and carries a stable identifier, so you can add your own values or distinguish neighbouring areas with a categorical colour scheme.
Open map →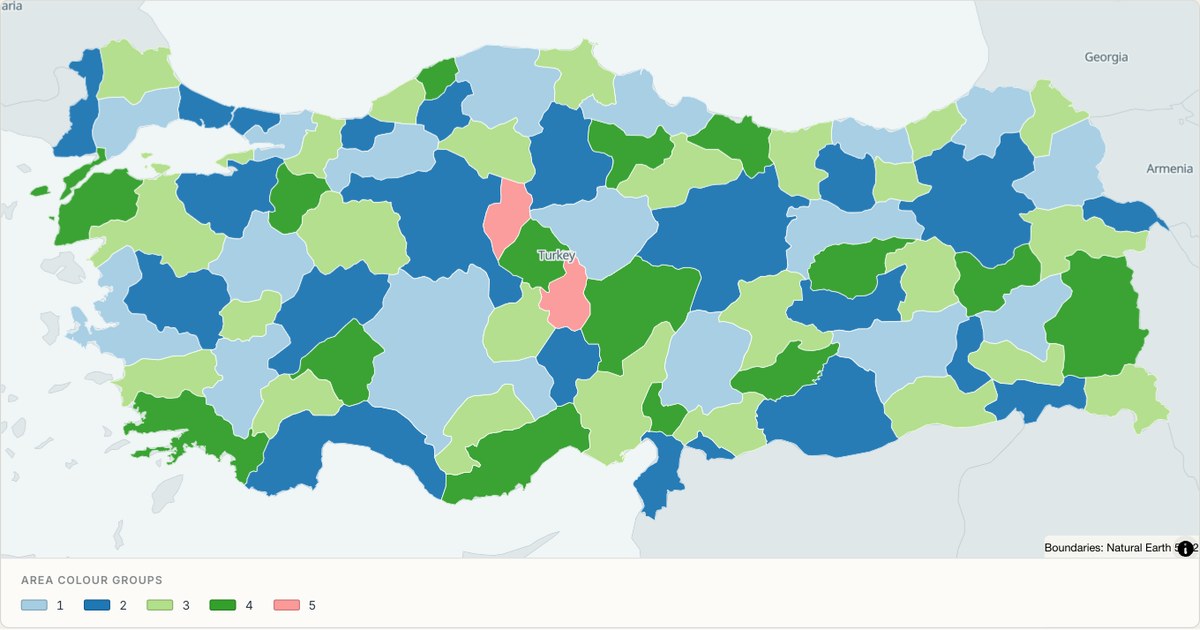 TopoJSONCategorical regions
Turkey administrative map
Explore 81 named areas in Turkey. Each boundary is selectable and carries a stable identifier, so you can add your own values or distinguish neighbouring areas with a categorical colour scheme.
Open map →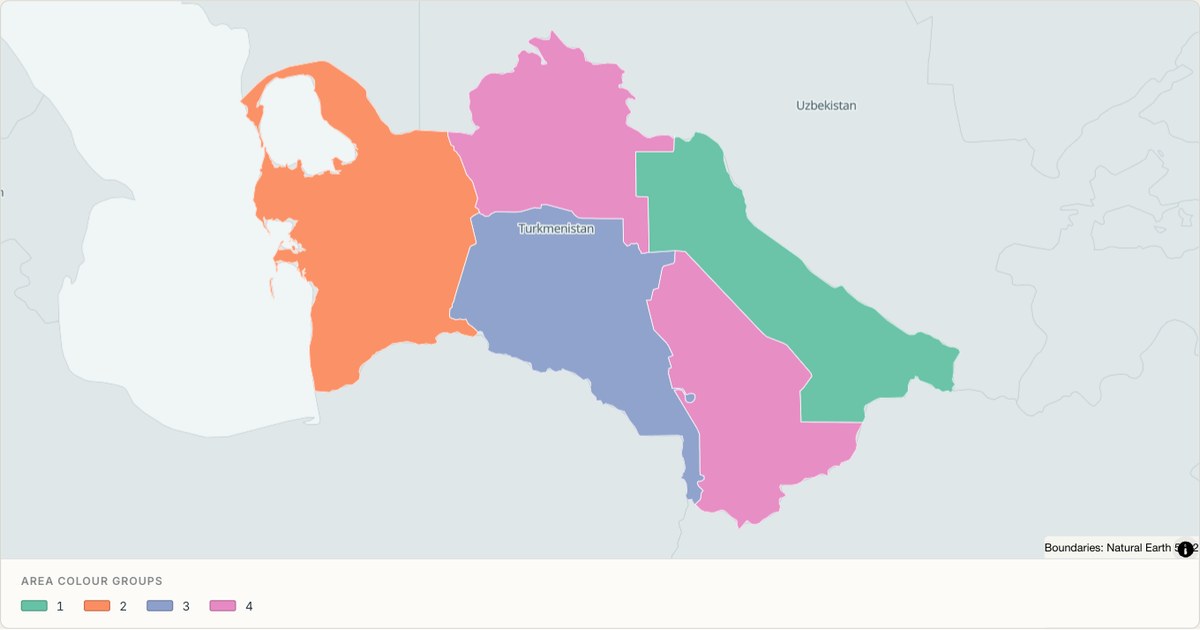 TopoJSONCategorical regions
Turkmenistan administrative map
Explore 5 named areas in Turkmenistan. Each boundary is selectable and carries a stable identifier, so you can add your own values or distinguish neighbouring areas with a categorical colour scheme.
Open map →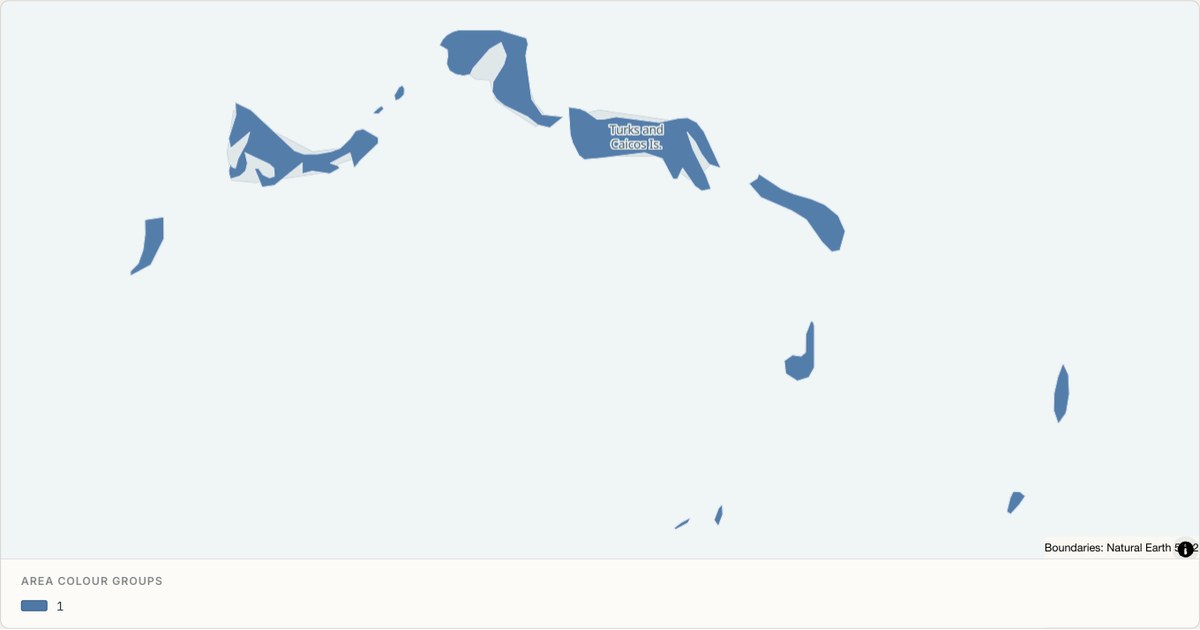 TopoJSONCategorical regions
Turks and Caicos Islands administrative map
Explore 6 named areas in Turks and Caicos Islands. Each boundary is selectable and carries a stable identifier, so you can add your own values or distinguish neighbouring areas with a categorical colour scheme.
Open map →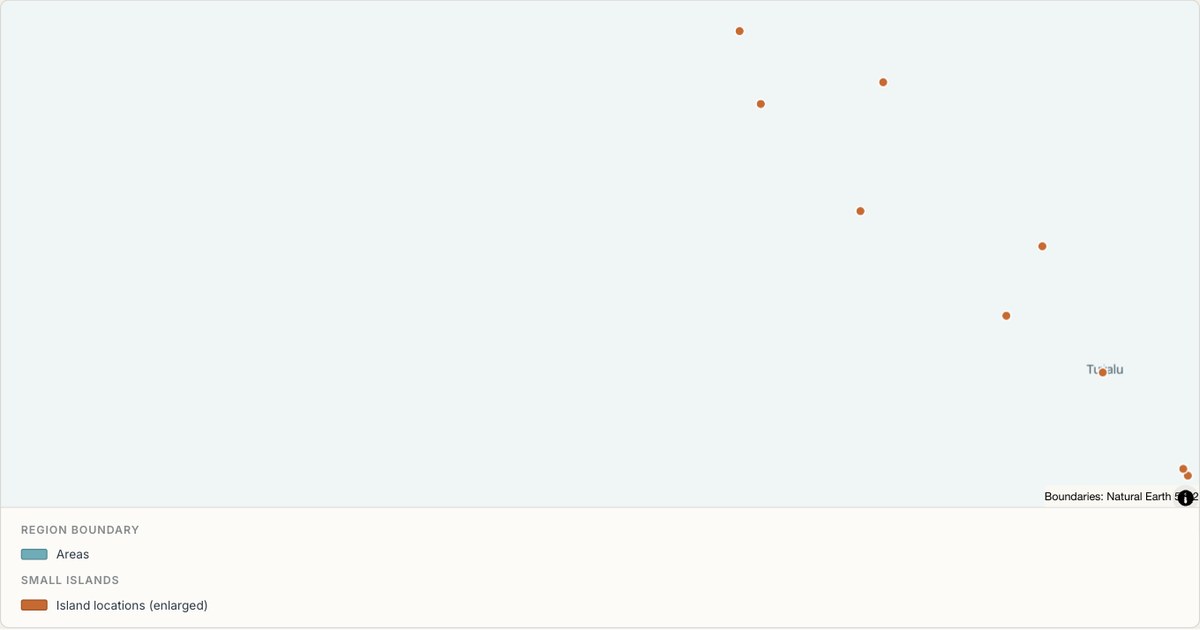 TopoJSONSingle boundary
Tuvalu boundary map
Explore the boundary supplied for Tuvalu. This snapshot contains one feature and does not provide internal subdivisions. Inspect its identifier and source attributes, or use it as a starting outline for your own map.
Open map →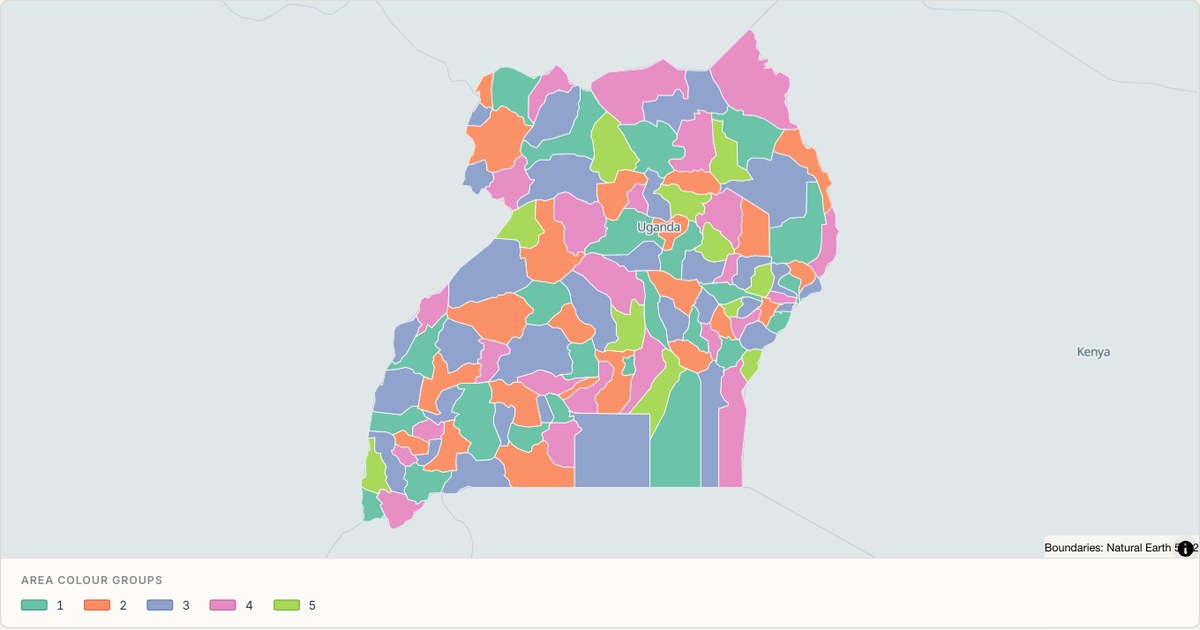 TopoJSONCategorical regions
Uganda administrative map
Explore 112 named areas in Uganda. Each boundary is selectable and carries a stable identifier, so you can add your own values or distinguish neighbouring areas with a categorical colour scheme.
Open map →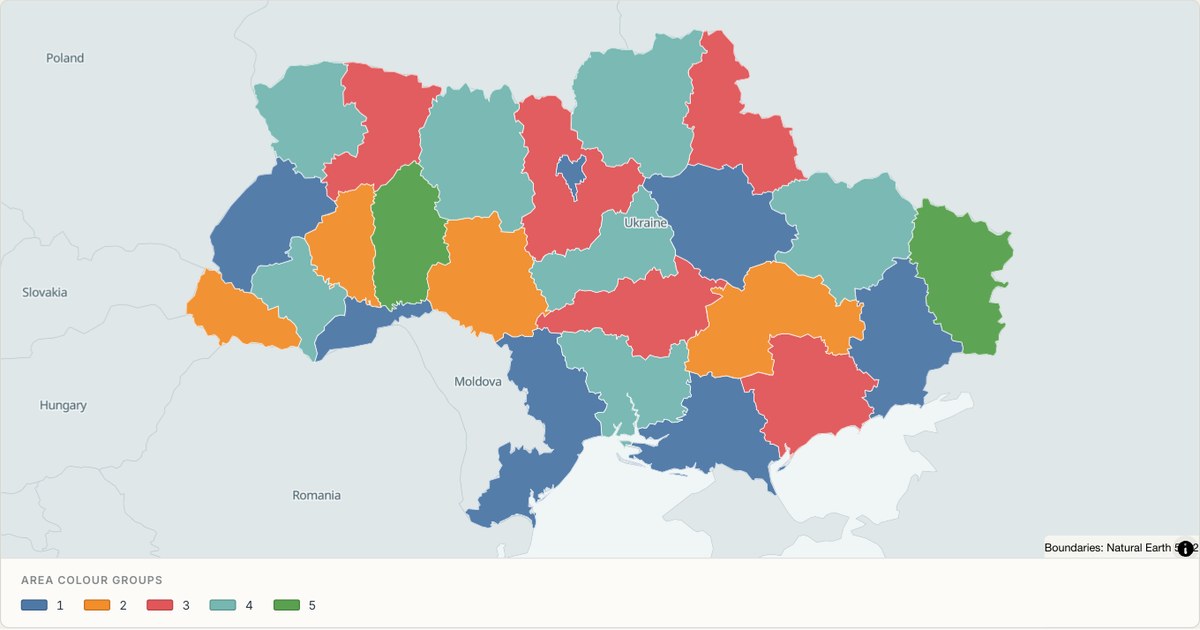 TopoJSONCategorical regions
Ukraine administrative map
Explore 25 named areas in Ukraine. Each boundary is selectable and carries a stable identifier, so you can add your own values or distinguish neighbouring areas with a categorical colour scheme.
Open map →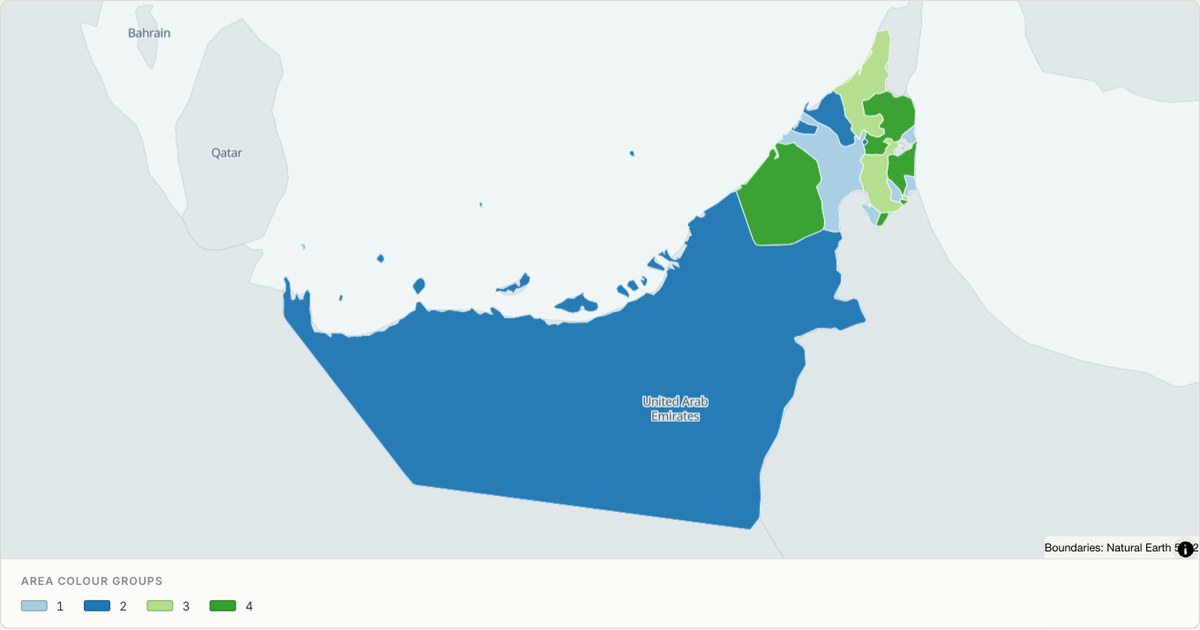 TopoJSONCategorical regions
United Arab Emirates administrative map
Explore 9 named areas in United Arab Emirates. Each boundary is selectable and carries a stable identifier, so you can add your own values or distinguish neighbouring areas with a categorical colour scheme.
Open map →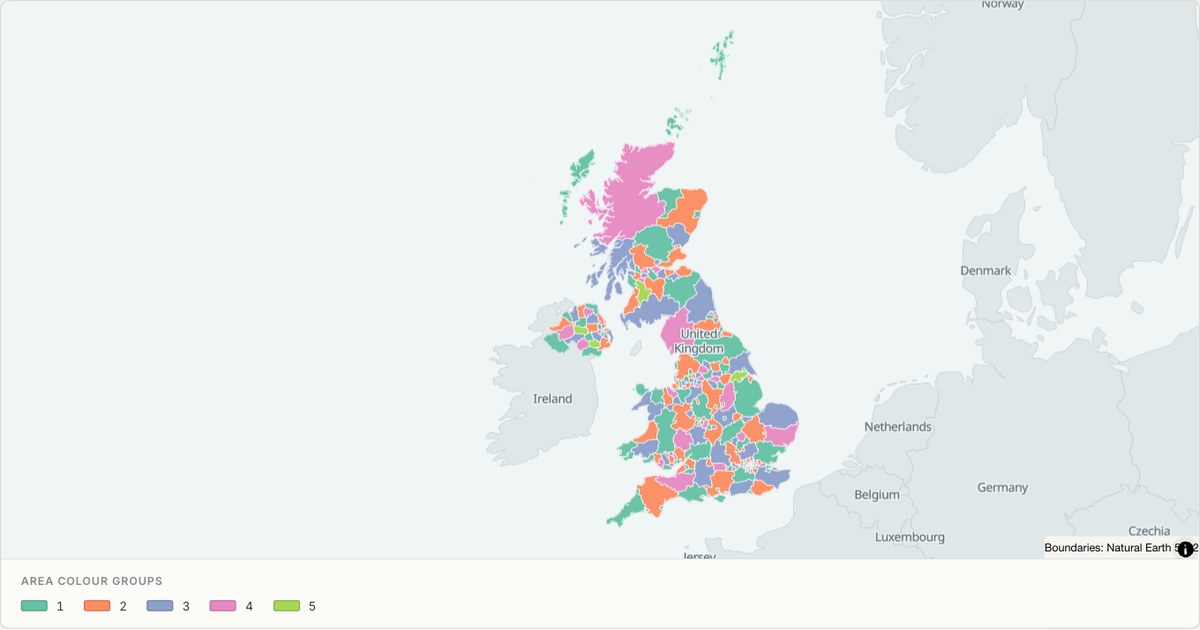 TopoJSONCategorical regions
United Kingdom administrative map
Explore 232 named areas in United Kingdom. Each boundary is selectable and carries a stable identifier, so you can add your own values or distinguish neighbouring areas with a categorical colour scheme.
Open map →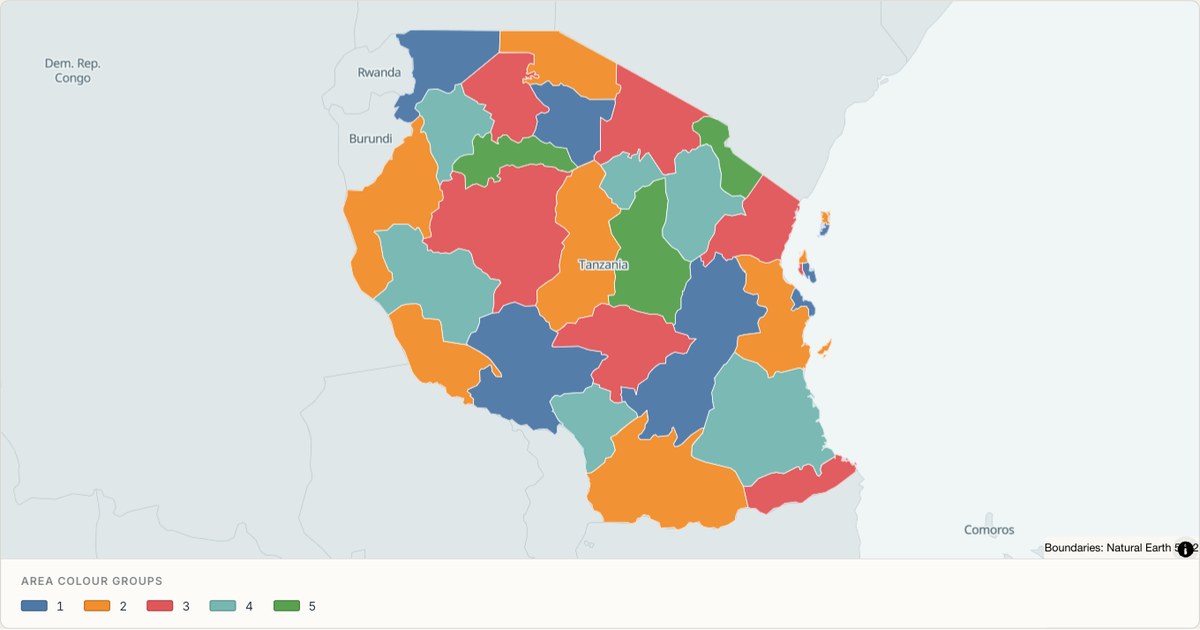 TopoJSONCategorical regions
United Republic of Tanzania administrative map
Explore 30 named areas in United Republic of Tanzania. Each boundary is selectable and carries a stable identifier, so you can add your own values or distinguish neighbouring areas with a categorical colour scheme.
Open map →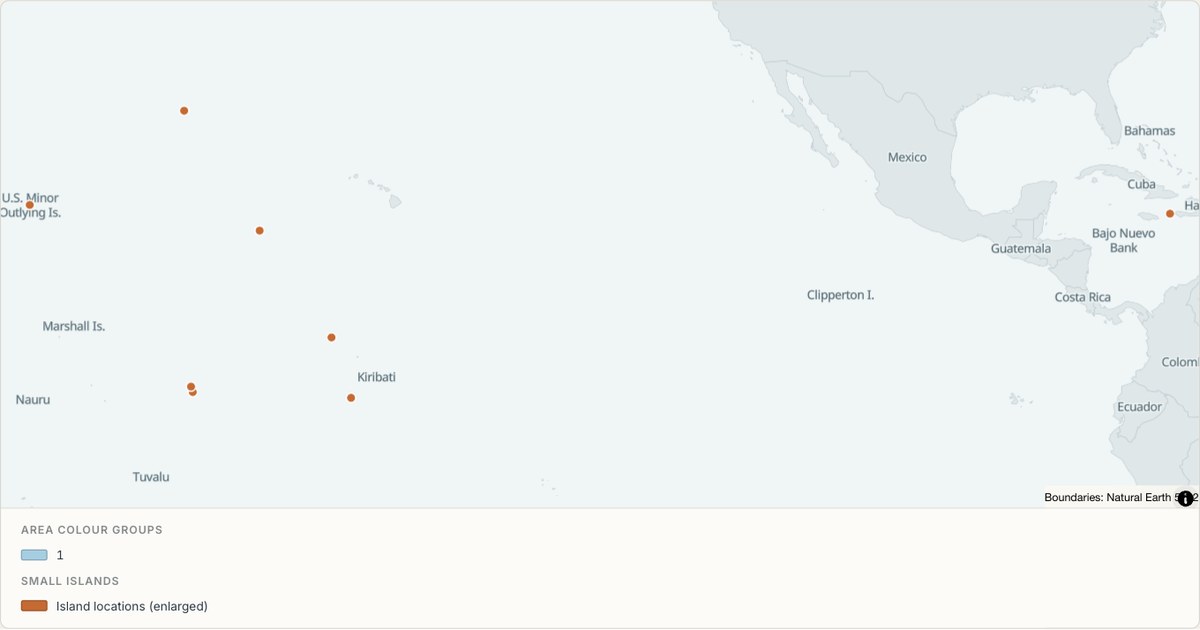 TopoJSONCategorical regions
United States Minor Outlying Islands administrative map
Explore 8 named areas in United States Minor Outlying Islands. Each boundary is selectable and carries a stable identifier, so you can add your own values or distinguish neighbouring areas with a categorical colour scheme.
Open map →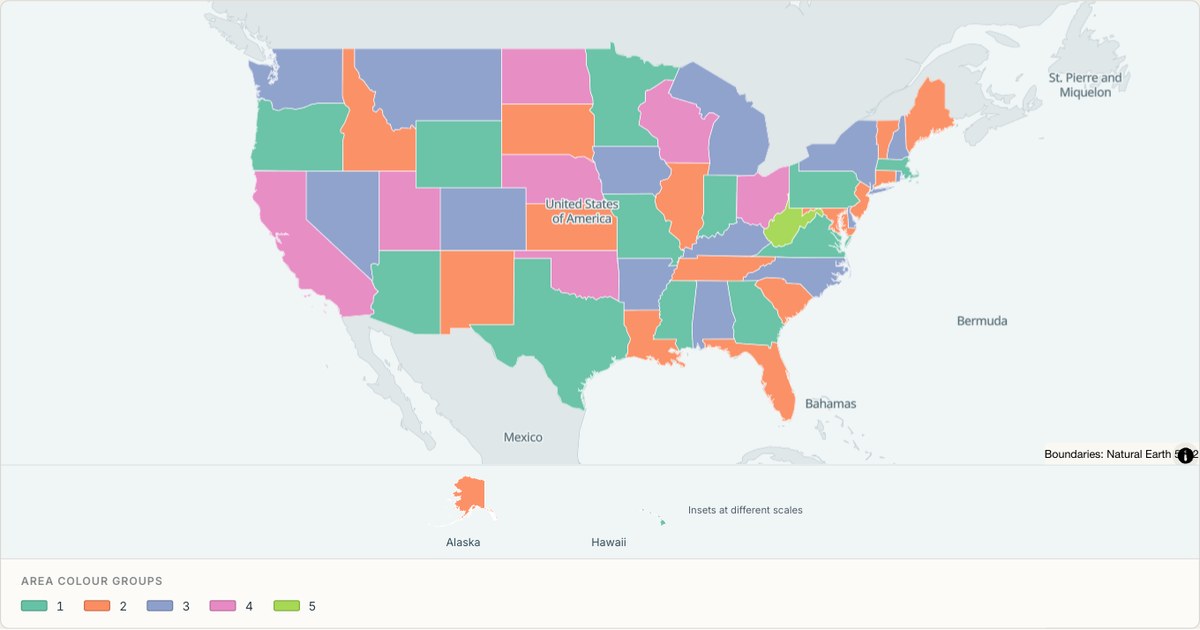 TopoJSONCategorical regions
United States of America administrative map
Explore 51 named areas in United States of America. Each boundary is selectable and carries a stable identifier, so you can add your own values or distinguish neighbouring areas with a categorical colour scheme.
Open map →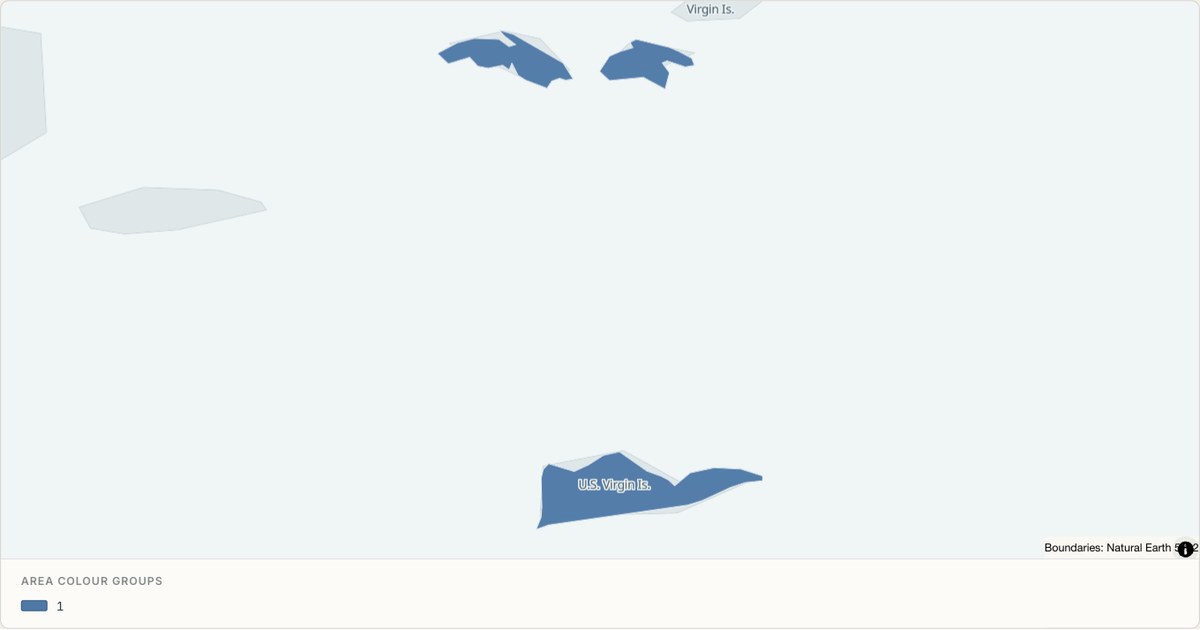 TopoJSONCategorical regions
United States Virgin Islands administrative map
Explore 3 named areas in United States Virgin Islands. Each boundary is selectable and carries a stable identifier, so you can add your own values or distinguish neighbouring areas with a categorical colour scheme.
Open map →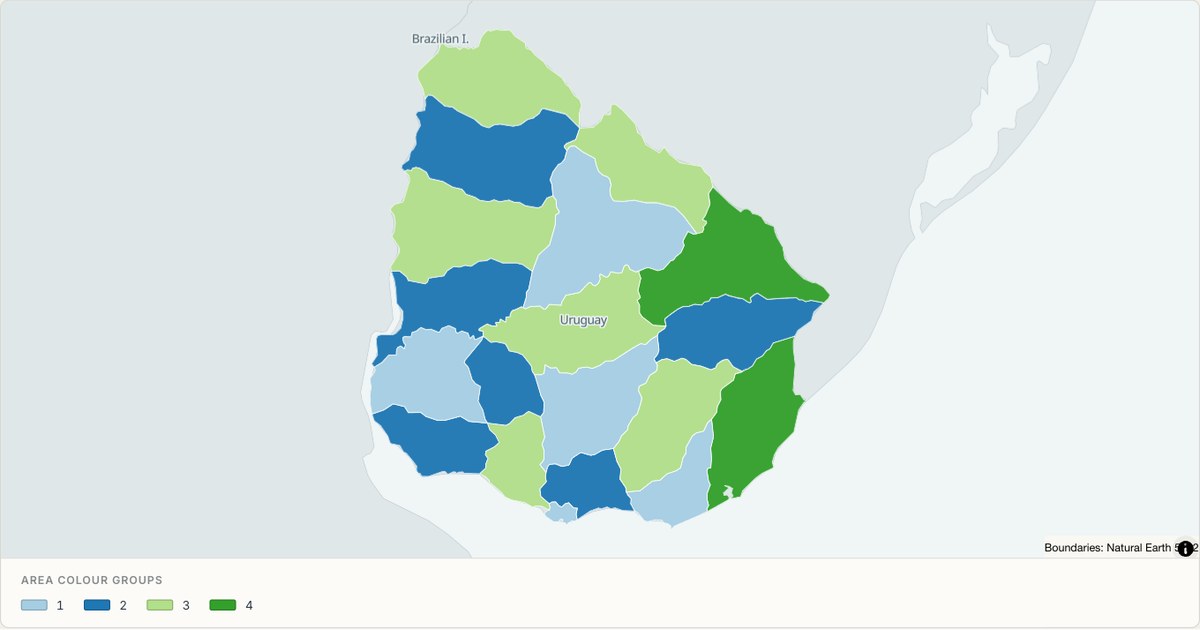 TopoJSONCategorical regions
Uruguay administrative map
Explore 19 named areas in Uruguay. Each boundary is selectable and carries a stable identifier, so you can add your own values or distinguish neighbouring areas with a categorical colour scheme.
Open map →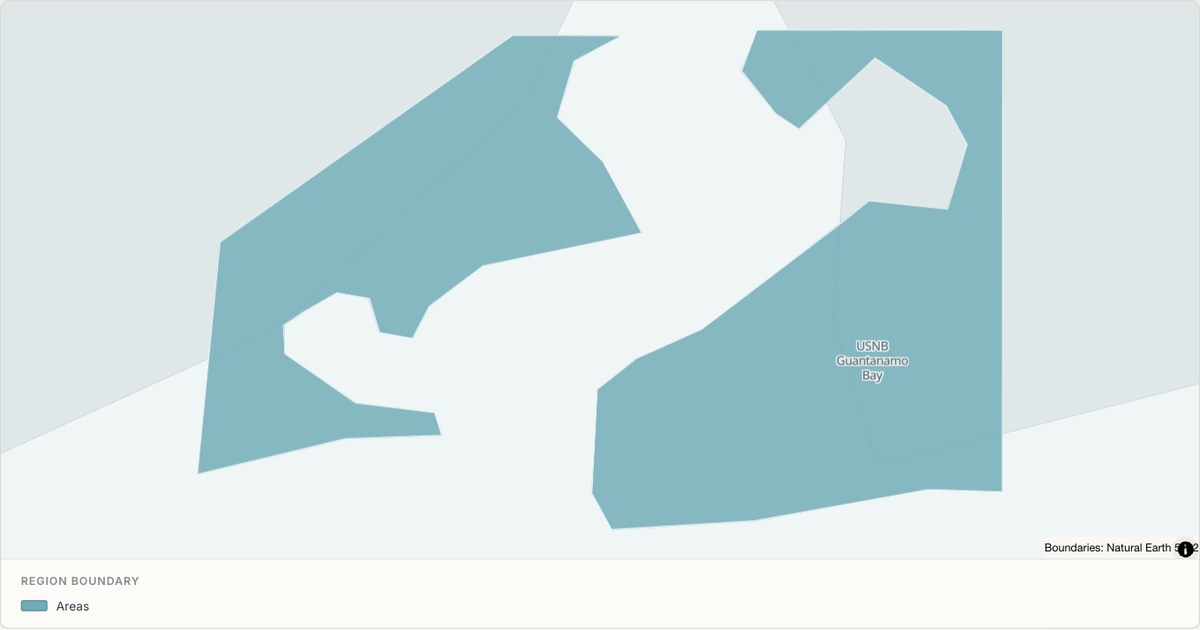 TopoJSONSingle boundary
US Naval Base Guantanamo Bay boundary map
Explore the boundary supplied for US Naval Base Guantanamo Bay. This snapshot contains one feature and does not provide internal subdivisions. Inspect its identifier and source attributes, or use it as a starting outline for your own map.
Open map →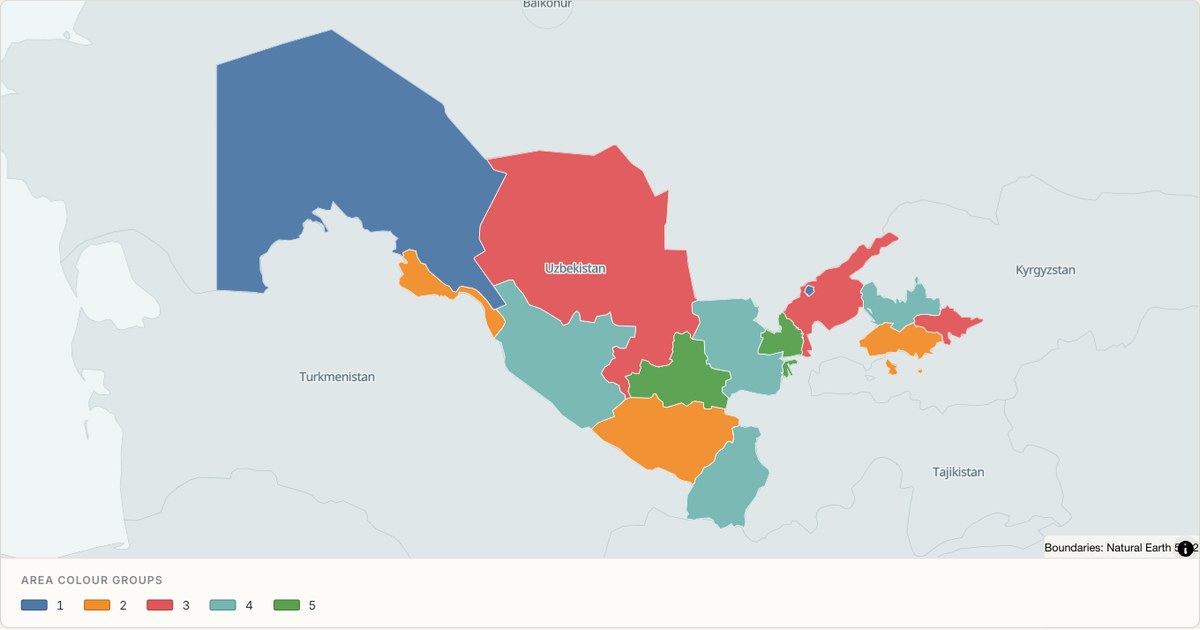 TopoJSONCategorical regions
Uzbekistan administrative map
Explore 14 named areas in Uzbekistan. Each boundary is selectable and carries a stable identifier, so you can add your own values or distinguish neighbouring areas with a categorical colour scheme.
Open map →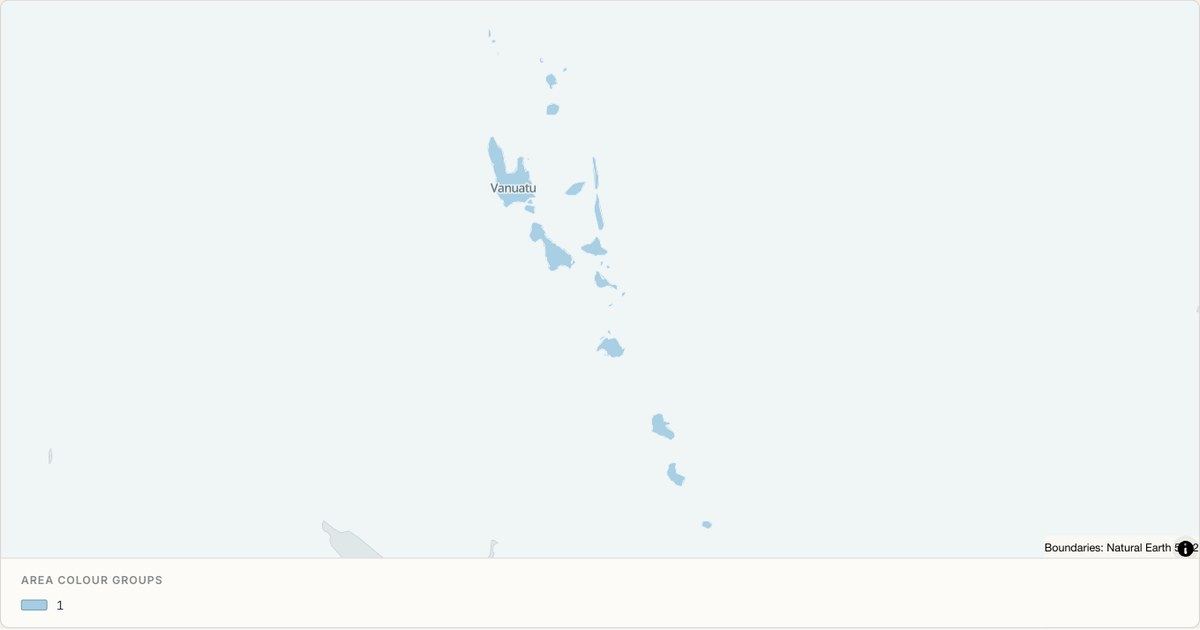 TopoJSONCategorical regions
Vanuatu administrative map
Explore 6 named areas in Vanuatu. Each boundary is selectable and carries a stable identifier, so you can add your own values or distinguish neighbouring areas with a categorical colour scheme.
Open map →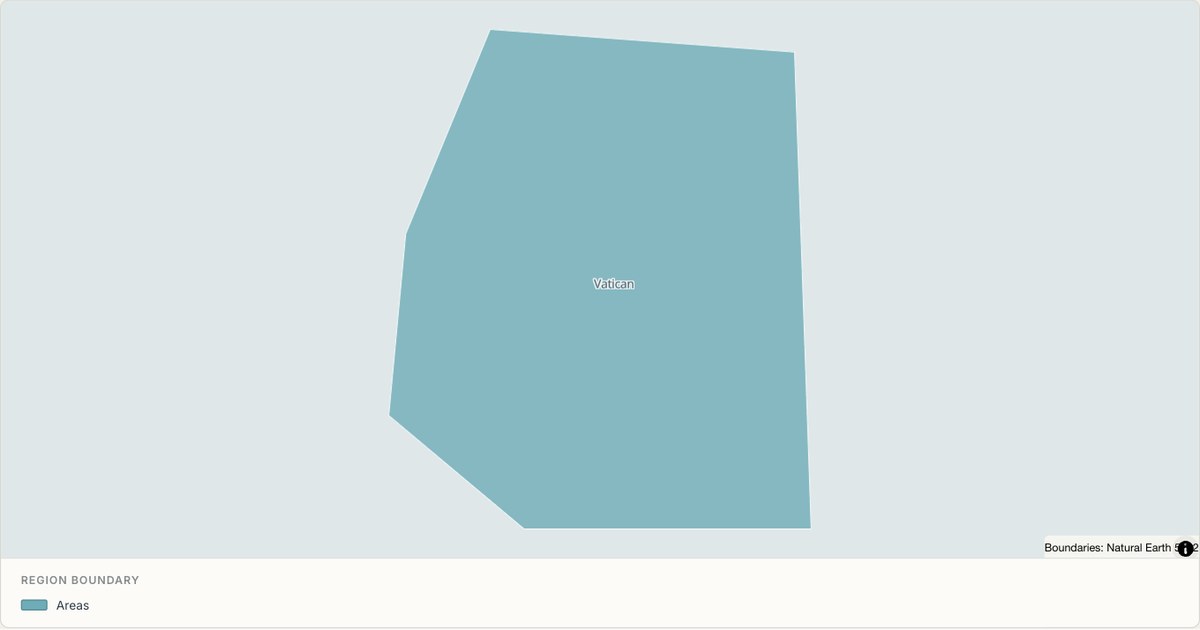 TopoJSONSingle boundary
Vatican boundary map
Explore the boundary supplied for Vatican. This snapshot contains one feature and does not provide internal subdivisions. Inspect its identifier and source attributes, or use it as a starting outline for your own map.
Open map →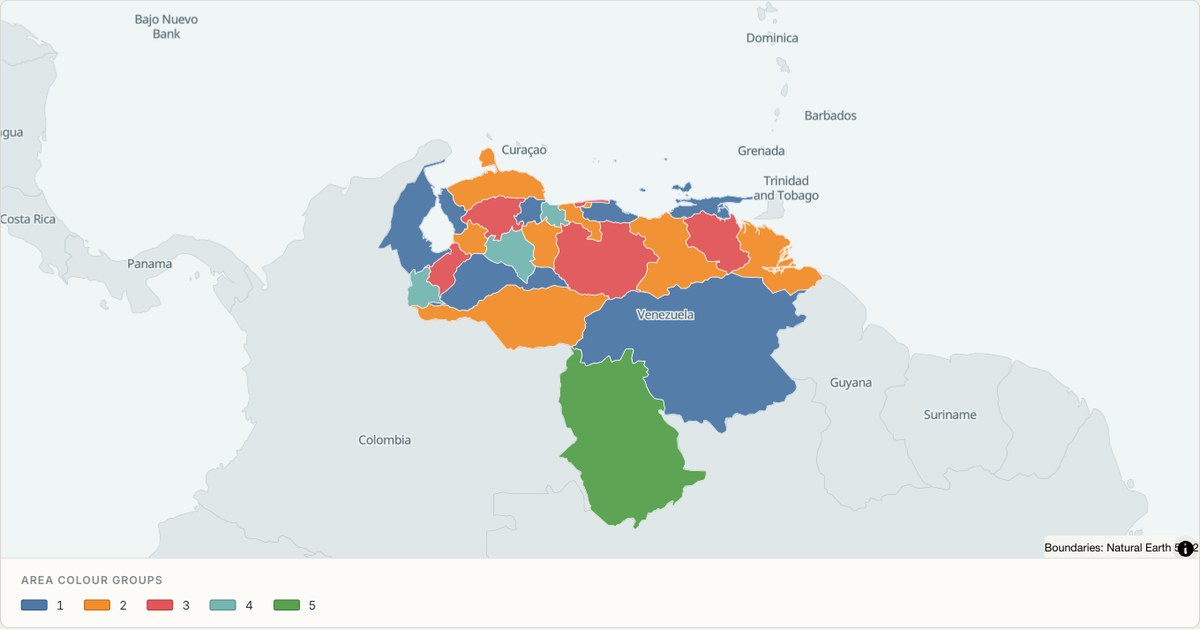 TopoJSONCategorical regions
Venezuela administrative map
Explore 26 named areas in Venezuela. Each boundary is selectable and carries a stable identifier, so you can add your own values or distinguish neighbouring areas with a categorical colour scheme.
Open map →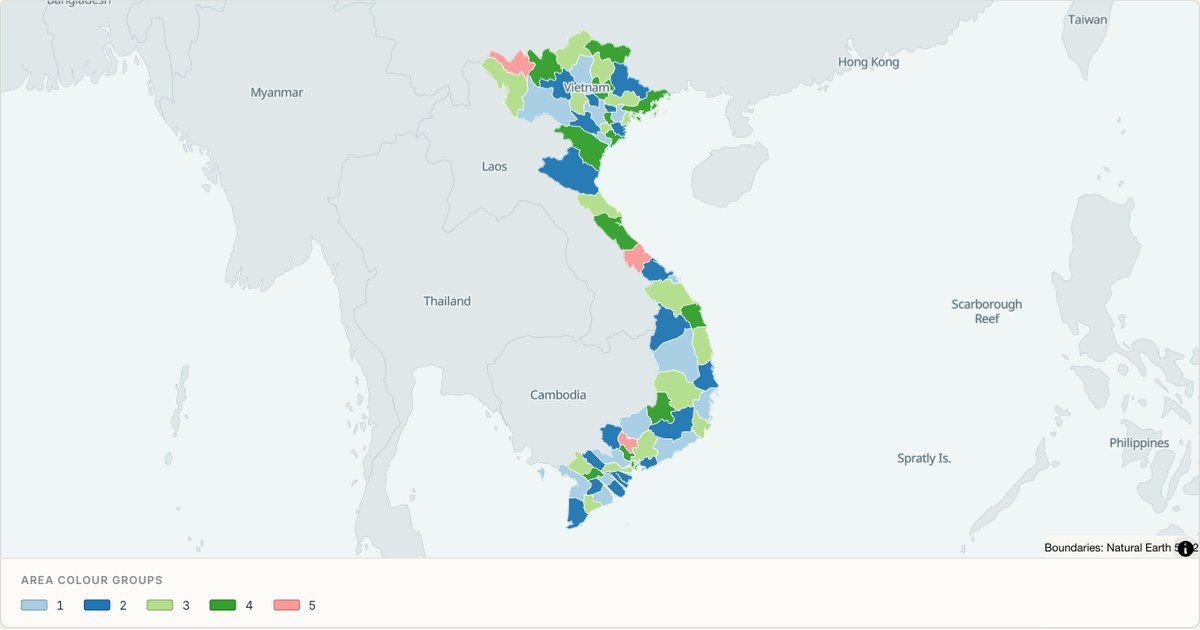 TopoJSONCategorical regions
Vietnam administrative map
Explore 63 named areas in Vietnam. Each boundary is selectable and carries a stable identifier, so you can add your own values or distinguish neighbouring areas with a categorical colour scheme.
Open map →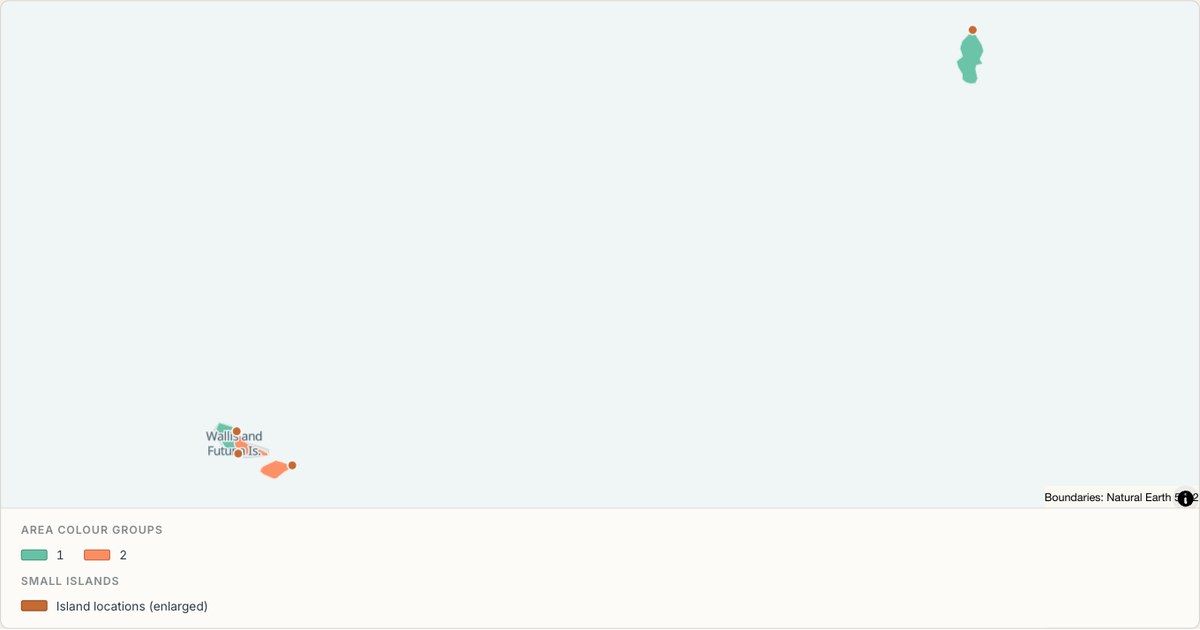 TopoJSONCategorical regions
Wallis and Futuna administrative map
Explore 3 named areas in Wallis and Futuna. Each boundary is selectable and carries a stable identifier, so you can add your own values or distinguish neighbouring areas with a categorical colour scheme.
Open map →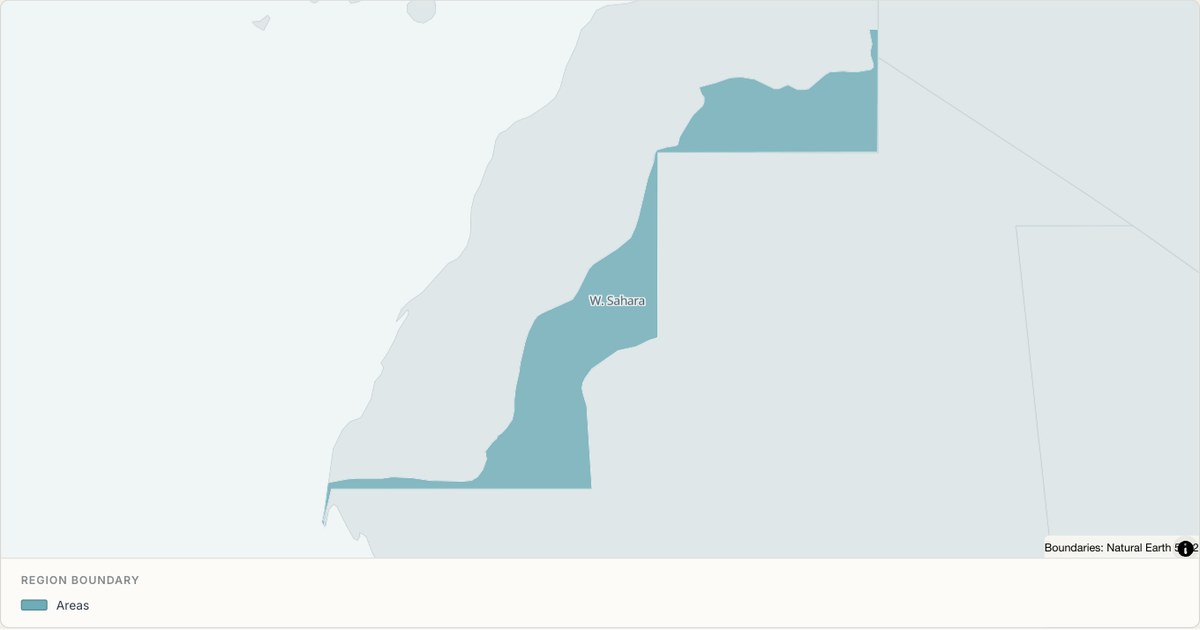 TopoJSONSingle boundary
Western Sahara boundary map
Explore the boundary supplied for Western Sahara. This snapshot contains one feature and does not provide internal subdivisions. Inspect its identifier and source attributes, or use it as a starting outline for your own map.
Open map →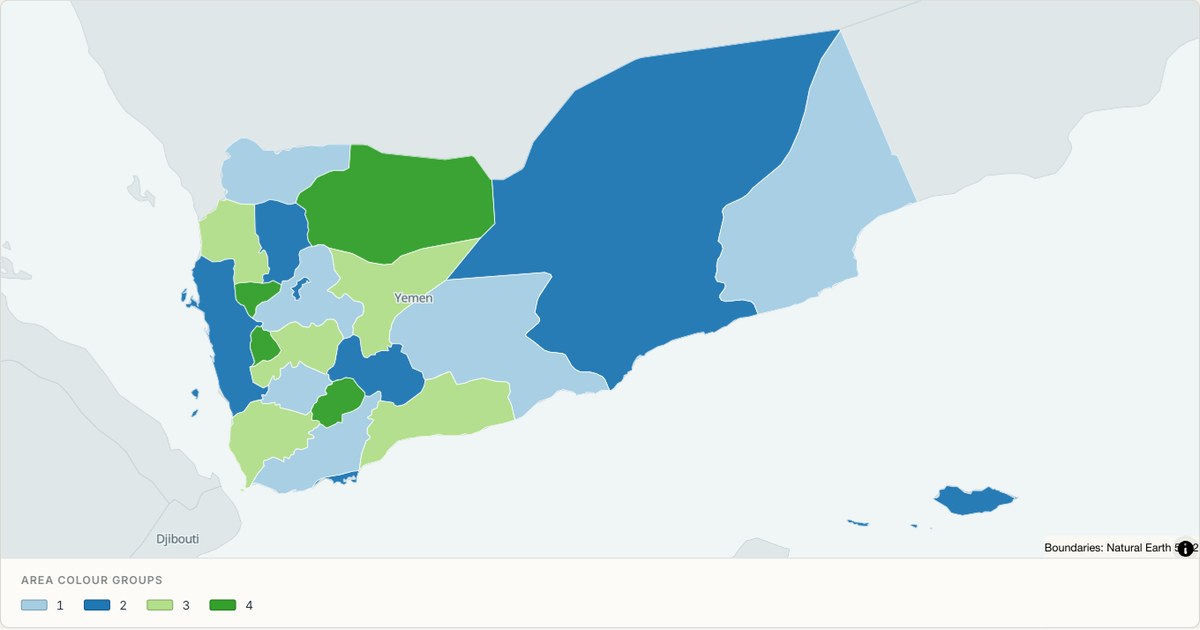 TopoJSONCategorical regions
Yemen administrative map
Explore 21 named areas in Yemen. Each boundary is selectable and carries a stable identifier, so you can add your own values or distinguish neighbouring areas with a categorical colour scheme.
Open map →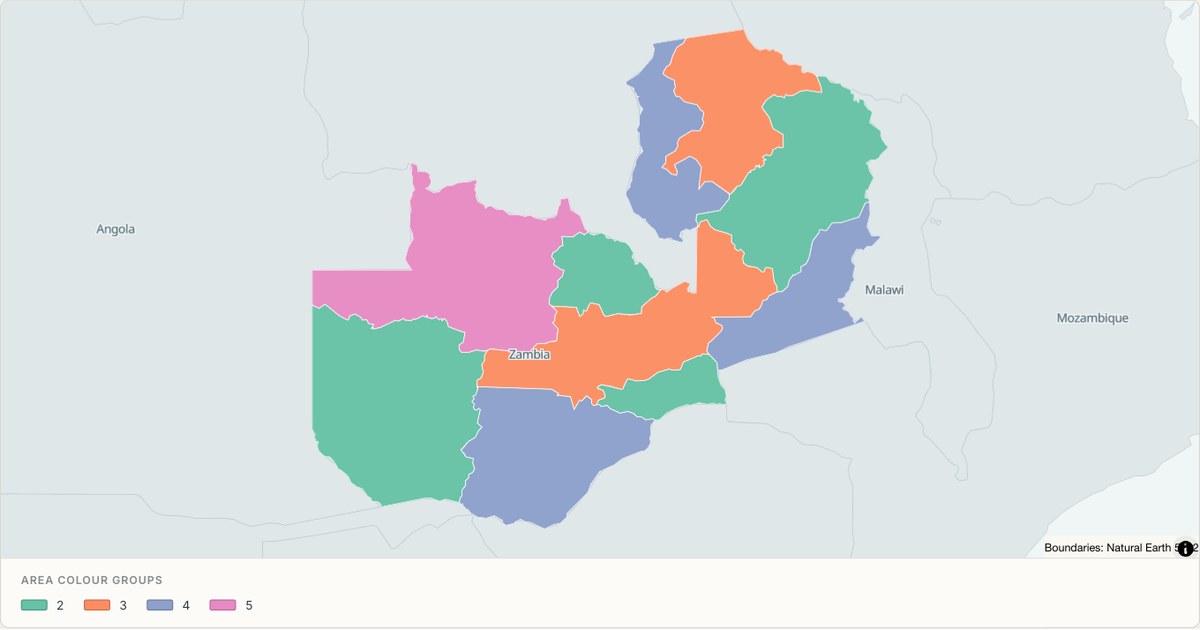 TopoJSONCategorical regions
Zambia administrative map
Explore 10 named areas in Zambia. Each boundary is selectable and carries a stable identifier, so you can add your own values or distinguish neighbouring areas with a categorical colour scheme.
Open map →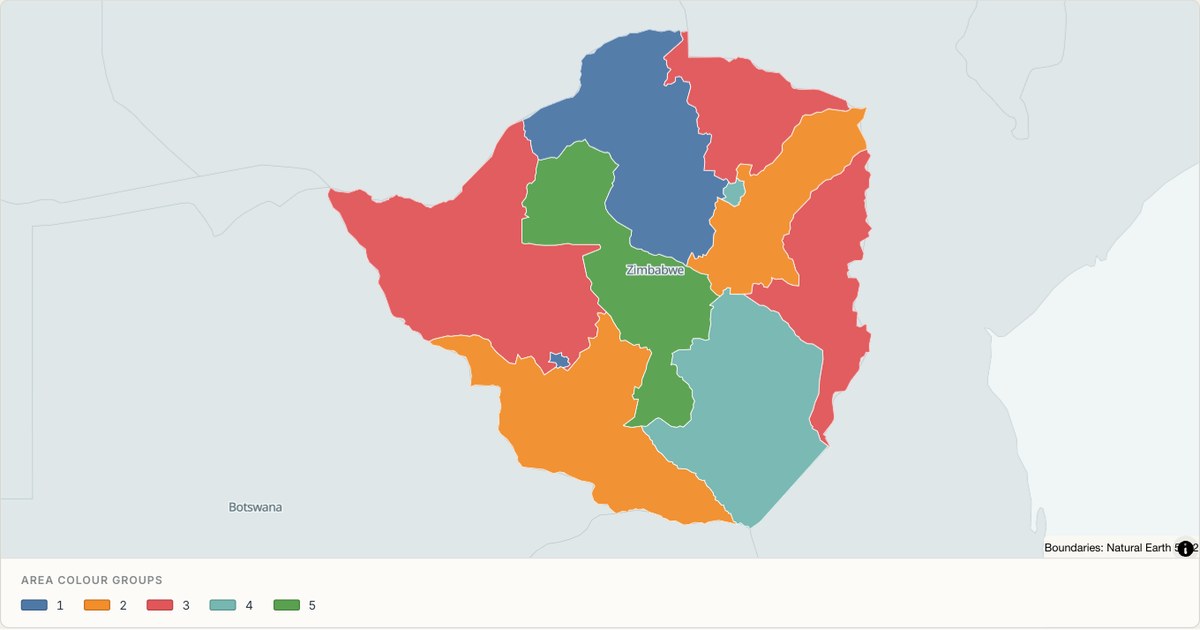 TopoJSONCategorical regions
Zimbabwe administrative map
Explore 10 named areas in Zimbabwe. Each boundary is selectable and carries a stable identifier, so you can add your own values or distinguish neighbouring areas with a categorical colour scheme.
Open map →
choropleth map questions
- Can I colour regions from an Excel table?
- The studio does not automatically join a separate table to boundaries. Prepare a polygon file with the values attached, then choose the value property for colour. Built-in boundaries can be added separately.
- What does grey mean?
- On a numeric map it can indicate a missing or invalid value. Read the legend: a categorical or single-colour map can use grey for a different purpose.
- Are all regional examples statistical choropleths?
- No. Some use dated population or indicator data; others use adjacency colour groups or a single boundary. Each example names its map type and explains its data.